Figure 6.
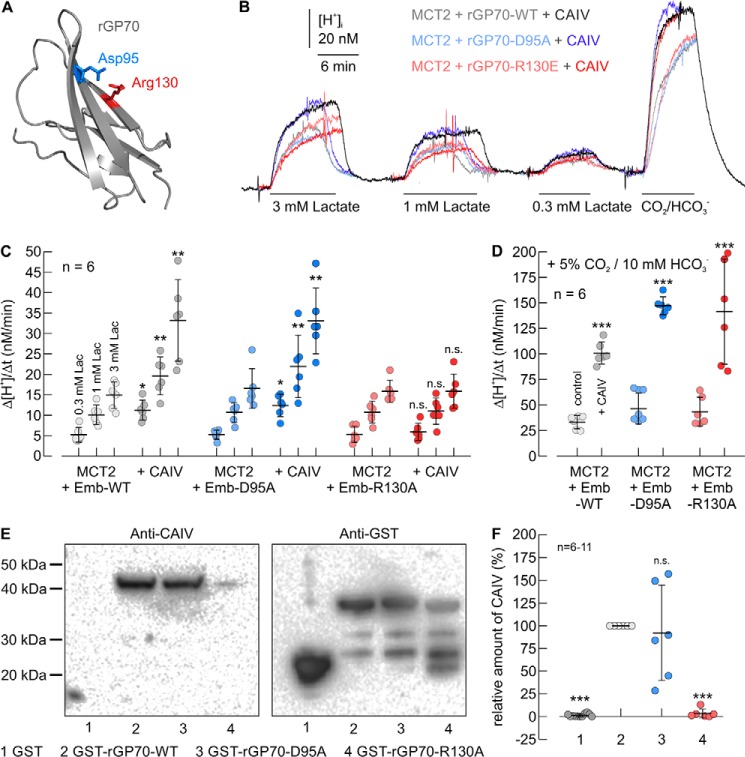
Functional interaction between rat MCT2 and CAIV in Xenopus oocytes requires direct binding of CAIV to Arg-130 in the Ig1 domain of rGP70. A, homology structure of the Ig1 domain of rat GP70 (based on human CD147, PDB code 3B5H (37)). Glu-95 and Arg-130 are labeled in blue and red, respectively. B, original recordings of the change in intracellular H+ concentration during application of lactate and CO2/HCO3− in Xenopus oocytes, expressing rMCT2 together with rGP70–WT (gray traces), rGP70–D95A (blue traces), and rGP70–R130A (red traces), respectively. Cells were either expressing rMCT2 + rGP70 alone (light traces) or rMCT2 + rGP70 and human CAIV (dark traces). C and D, rate of change in intracellular H+ concentration (Δ[H+]/Δt) during application of lactate (C) and 5% CO2, 10 mm HCO3− (D) in Xenopus oocytes, expressing rMCT2 and rGP70–WT (gray dots), rGP70–D95A (blue dots), and rGP70–R130A (red dots), respectively. Cells were either expressing rMCT2 + rGP70 alone (light dots) or rMCT1 + rGP70 and human CAIV (dark dots). The significance indicators above the dots with CAIV (dark dots) refer to the corresponding dots without CAIV (light dots of same color). E, representative Western blots of CAIV (left blot) and GST (right blot), respectively. CAIV was pulled down with GST (lane 1), a GST fusion protein of the Ig1 domain of rGP70–WT (lane 2), a GST fusion protein of Ig1 domain of rGP70–D95A (lane 3), and a GST fusion protein of Ig1 domain of rGP70–R130A (lane 4). F, relative intensity of the fluorescent signal of CAIV. For every blot, the signals for CAIV were normalized to the corresponding signals for GST–rGP70–WT. Each individual signal for CAIV was normalized to the intensity of the signal for GST in the same lane. The significance indicators above the dots refer to GST–rGP70–WT.

