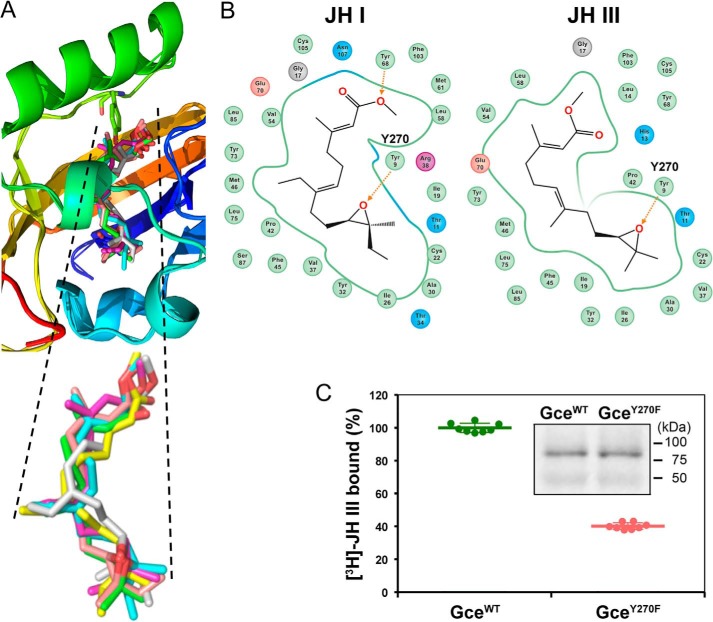
Figure 6.
Modeling of JH interaction with the Gce protein. A, docking of the native conformations R-JH-III (green) and S-(E,E)-JH I (cyan) and of the JH I isomers S-(E,Z) (yellow), S-(Z,E) (magenta), R-(E,Z) (gray), and R-(Z,E) (pink) in the model of the PAS-B–binding pocket of Drosophila Gce. B, two-dimensional interaction diagrams of the native JH I (left) and JH III (right) with the PAS-B domain of Drosophila Gce. Numbers are amino acid positions within the modeled region; corresponding positions within the Drosophila Gce protein (NCBI Reference Sequence NP_511160.1) are the displayed numbers plus 261 (i.e. Tyr-9 is Tyr-270). C, loss of the hydroxyl group in the mutated GceY270F protein reduced the amount of bound [3H]JH III to 40% of the WT (GceWT) protein (n = 8; p < 4.83 × 10⁻¹⁷, t test). Data are mean values; error bars represent S.D. Inset, immunoblot of the in vitro expressed, Myc-tagged Gce proteins used in the binding assay.

