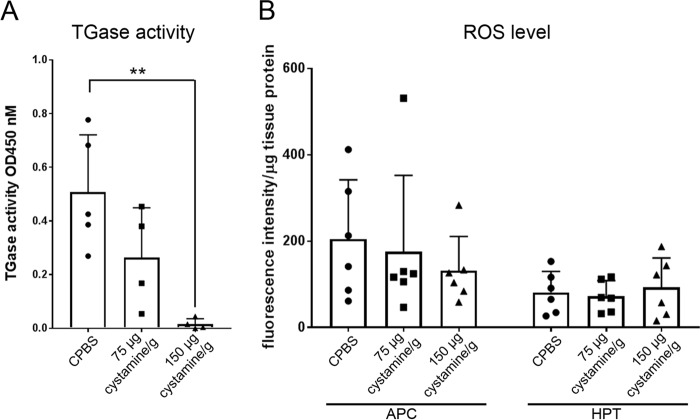
Figure 2.
Effect of cystamine on in vivo TGase activity in HPT and ROS production in vivo. A, TGase activity in HPT at 3 h after injection of cystamine (75 μg cystamine/g or 150 μg cystamine/g) or CPBS as a control. The columns represent the mean from four to five crayfish, and the error bar represents the S.D. value. Each symbol represents an individual crayfish. **, p < 0.01 indicates a significant difference compared with the control. B, ROS production at 3 h post-injection of cystamine (75 μg cystamine/g and 150 μg cystamine/g) or CPBS as a control. The ROS level was calculated per microgram of tissue protein for each individual crayfish. Six crayfish were used in each experimental group. The columns represent the mean from six crayfish, and the error bar represents the S.D. value. Each symbol represents individual crayfish.

