Figure 5.
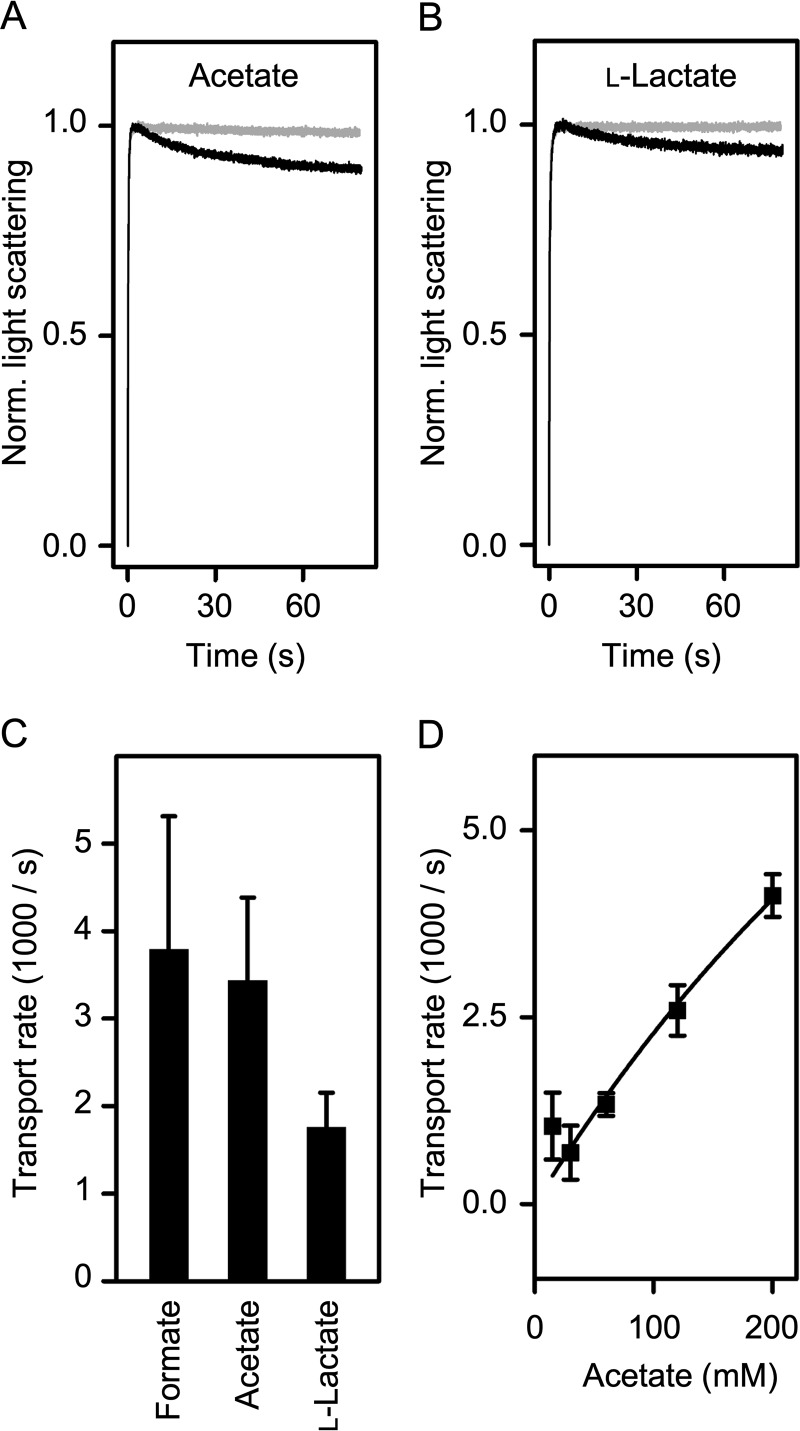
Substrate selectivity and affinity of EhFNT. A, transport of acetate via EhFNT (black trace) and empty liposomes (gray). B, transport of l-lactate via EhFNT (black trace) and empty liposomes (gray). C, comparison of EhFNT transport rates for formate, acetate, and l-lactate at 200 mm inward gradients. D, dependence of EhFNT transport rates on substrate concentration. Shown are the rates of acetate transport at concentrations in the range 15–200 mm. The error bars denote S.E. from three independent replicates.

