Figure 6.

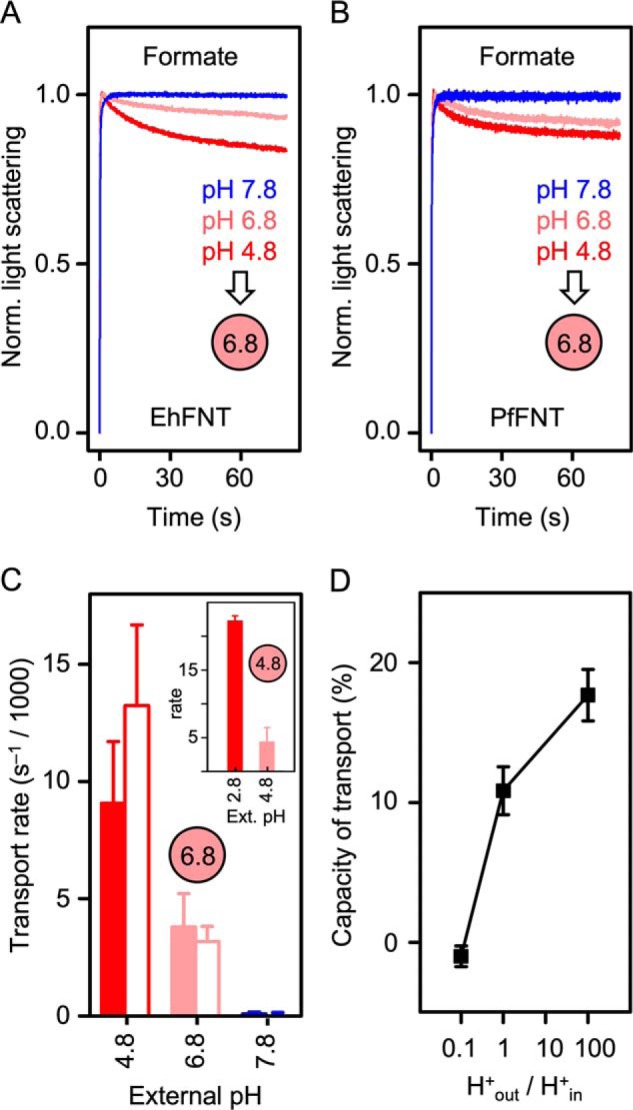
Effect of transmembrane proton gradients on the transport rates of EhFNT and PfFNT. A, EhFNT formate transport at external pH 4.8 (red), 6.8 (light red), and 7.8 (blue). B, formate transport via PfFNT at pH 4.8 (red), 6.8 (light red), and 7.8 (blue). The intra-liposomal pH (spheres) was 6.8 in all cases shown in A and B. C, formate transport rates of EhFNT (filled bars) and PfFNT (open bars) at different external pH conditions. The intra-liposomal pH was 6.8 or 4.8 (inset). D, transport capacity of formate into EhFNT proteoliposomes (% change of total light scattering intensity at 80 s time) in relationship to the steepness of the transmembrane proton gradient (H+out/H+in). The error bars indicate S.E. (n = 3).
