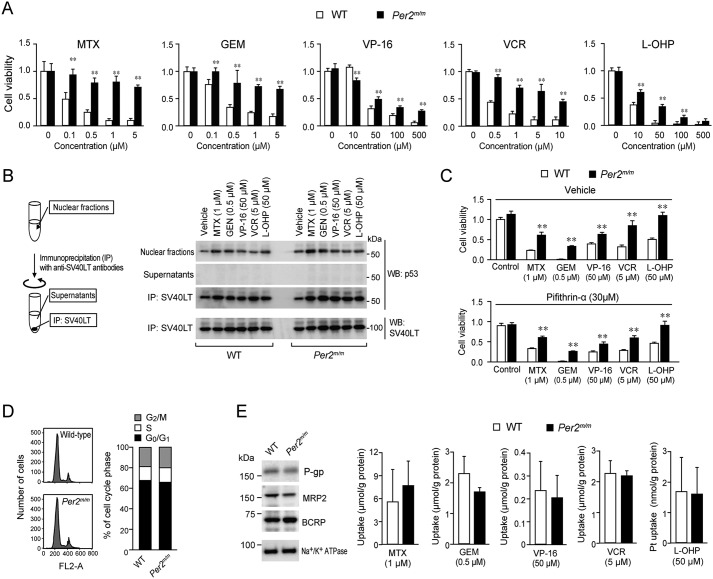
Figure 1.
Differences in the sensitivity to chemotherapeutic drugs between oncogene-transformed WT and Per2m/m cells. A, cells were treated with MTX, GEM, VP-16, VCR, or L-OHP at the indicated concentrations. After treatment for 48 h, cell viability was determined by an ATP luminescent assay. Values are means ± S.D. (error bars) (n = 3–4). **, p < 0.01 significantly different from WT cells. B, oncogene-transformed cells were treated with chemotherapeutic drugs for 24 h. Thereafter, cells were lysed and then subjected to immunoprecipitation with anti-SV40LT antibodies. The amounts of p53 and SV40LT in cell lysates, supernatants, and immunocomplexes were detected by Western blotting (WB). C, influence of p53 inhibitor pifithrin-α on the sensitivity of oncogene-transformed WT and Per2m/m cells to chemotherapeutic drugs. Cells were treated with chemotherapeutic drugs at the indicated concentrations in the presence or absence of pifithrin-α (30 μm). Cell viability was assessed 48 h after the initiation of drug treatment. Values are means ± S.D. (n = 4). **, p < 0.01 significantly different from WT cells. D, the analysis of cell-cycle distribution of oncogene-transformed WT and Per2m/m cells. There was no significant difference in the distribution of cell-cycle phase between the two genotypes (G2/M-phase, 22.01 ± 3.99% for WT and 23.02 ± 6.95% for Per2m/m; S-phase, 12.61 ± 4.26% for WT and 14.26 ± 2.78% for Per2m/m; G0/G1-phase, 65.38 ± 4.59% for WT and 62.73 ± 4.56% for Per2m/m; n = 4, means ± S.D.). E, left panel shows the expression profiles of P-gp, MRP2, and BCRP in oncogene-transformed WT and Per2m/m cells. Na+/K+-ATPase was used for membrane protein-loading control. The results shown are representative of three independent experiments. The right panels show intracellular accumulation of chemotherapeutic drugs in oncogene-transformed WT and Per2m/m cells. Concentrations of drugs were determined until 2 h after the addition of the drugs into the medium. Values shown are means ± S.D. (n = 3–4).

