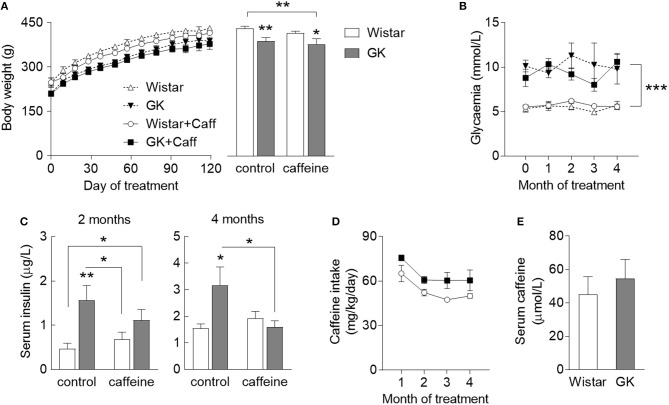
Figure 1.
Characteristics of diabetic GK rats (filed symbols/bars) and control Wistar rats (open symbols/bars), namely body weight (A) across the caffeine treatment period (line graph) and at the end of the study (bar graph), glycaemia (B), concentration in the serum insulin determined after 2 and 4 months of treatment (C), caffeine intake measured across the treatment period (D), and concentration of serum caffeine after 4 months of caffeine exposure (E). Caffeine (1 g/L) was provided through the drinking water for 4 months, starting at 2 months of age. Data are mean ± SEM of 8 rats per group. Symbols represent LSD test results after ANOVA with either significant diabetes effect or significant diabetes-caffeine interaction: *P < 0.05, **P < 0.01, ***P < 0.001 for GK vs. Wistar in the respective treatment group or as indicated.

