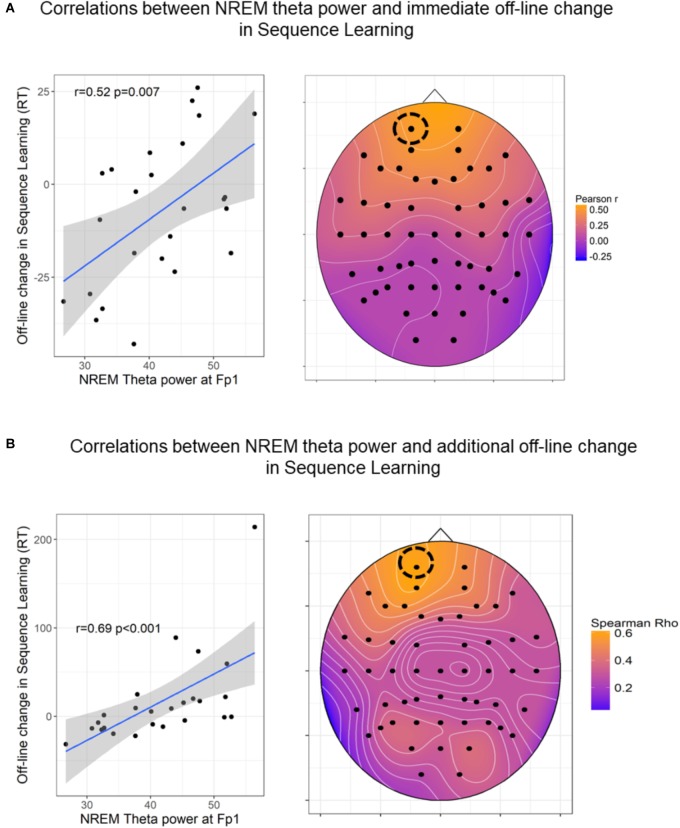
FIGURE 6.
Associations between NREM theta power and off-line changes in Sequence Learning. (A) Pearson correlations between NREM theta band power and immediate (7th vs. 6th epoch) post-sleep changes in Sequence Learning. (B) Spearman Rho correlations coefficients between NREM theta band power and delayed (8th vs. 6th epoch) post-sleep changes in Sequence Learning. The heat plots on the right indicate the magnitude of correlation coefficients, the scatterplots on the left show the association in a prominent (left frontal) electrode site. In case of 6B the correlation coefficient remained unchanged (r = 0.64, p < 0.001) after the exclusion of the outlier. The figures show uncorrected p-values (before FDR correction). For the immediate off-line changes, only Fp1, Fp2, AF3, AF4 locations remained significant after FDR correction. For the additional off-line changes, frontal channels Fp1, Fpz, Fp2, AF3, AF4, F7, F5, F3, F1, Fz, F2, F4, F6, F8 as well as FC4, FC5, CP5, and P5 locations remained significant after FDR correction.

