FIGURE 1.

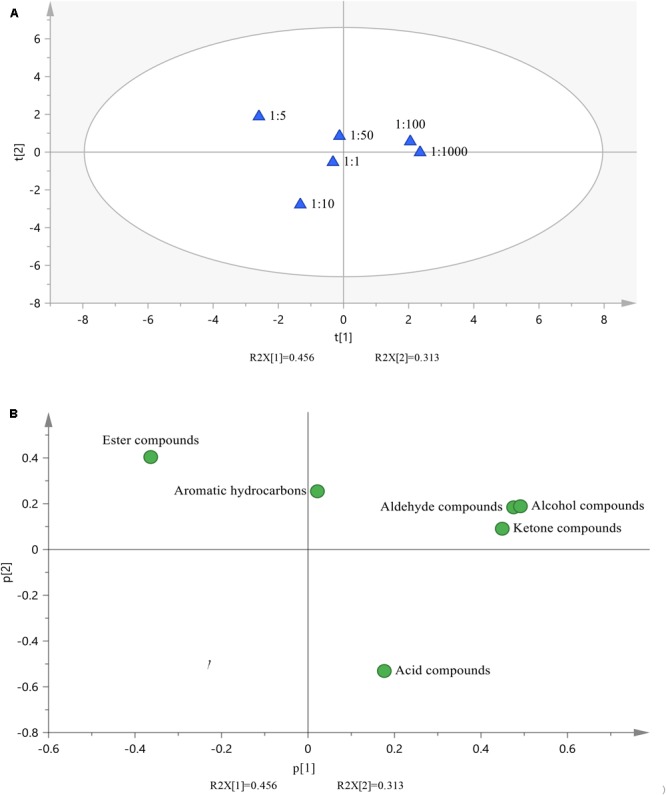
Principal component analysis. (A) Scatter plot of the component scores for milk fermented with six different ratios of probiotic strains. (B) Scatter plot of the loadings for six classes of volatile compounds.

Principal component analysis. (A) Scatter plot of the component scores for milk fermented with six different ratios of probiotic strains. (B) Scatter plot of the loadings for six classes of volatile compounds.