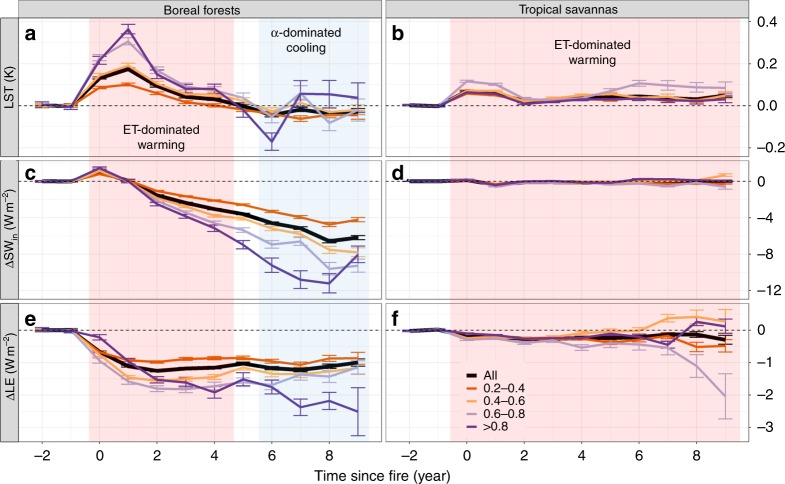
Fig. 3.
Land surface radiometric temperature (LST) after fire in boreal forests and tropical savannas. Time series plots of changes in land surface radiometric temperature (△LST, a, b), shortwave radiation (△SWin, c, d), and latent heat fluxes (△LE, e, f) for tropical savannas and boreal forests, stratified by different percent of area burned within each CMG grid (i.e., All, 0.2–0.4, 0.4–0.6, 0.6–0.8, > 0.8). Error bars are one standard deviation

