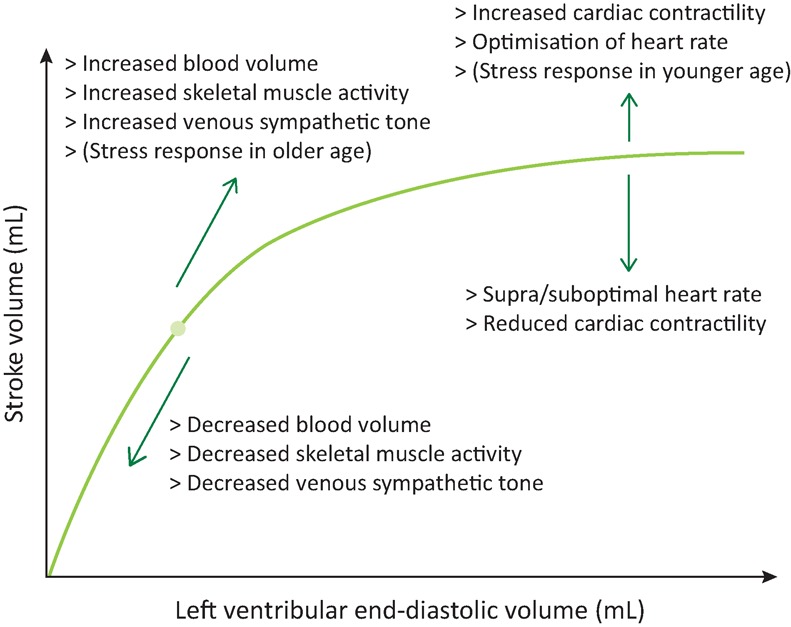
Fig 2.

The Frank–Starling Curve. This schematic of the Frank–Starling curve describes the effects of an increasing preload on the stroke volume and the factors that can alter this relationship. Some of these factors change a person's position on the curve by altering the preload (diagonal arrows) and others change the shape of the curve by altering the cardiac function directly (vertical arrows).
