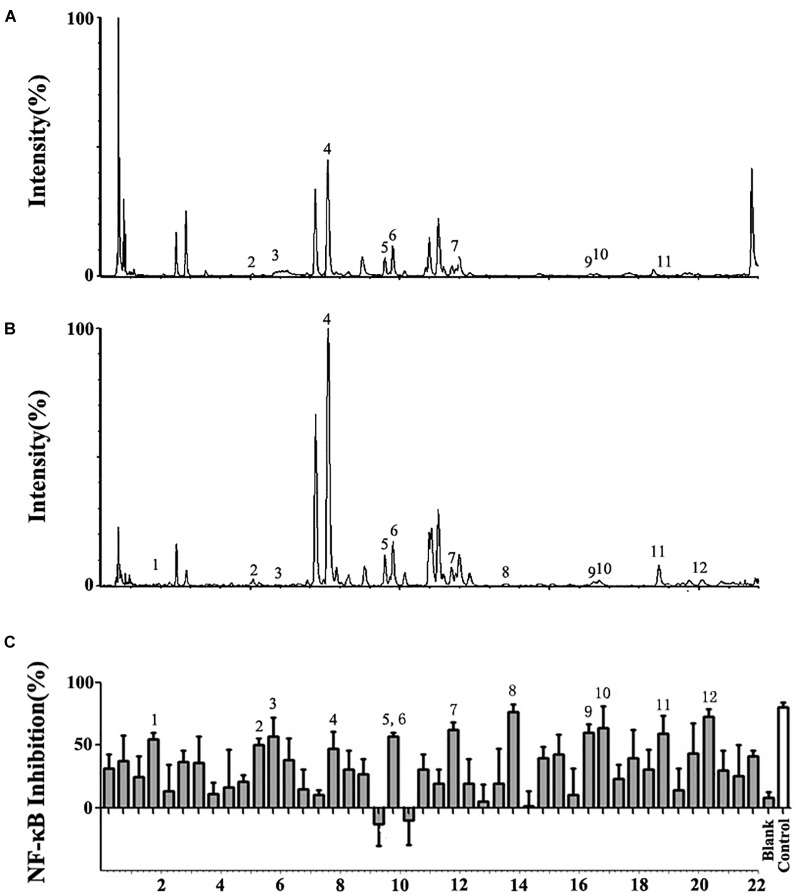
FIGURE 1.
UPLC/Q-TOF-MS/MS and bioactivity analysis of the Althaea rosea flowers. (A) Total Ion Chromatography (TIC) chromatograms in positive ESI mode. (B) TIC chromatograms in negative ESI mode. (C) Bioactivity chromatograms obtained via the luciferase reporter assay system for NF-κB inhibition. The peak numbers are consistent with those reported in Table 1.

