Figure 4.

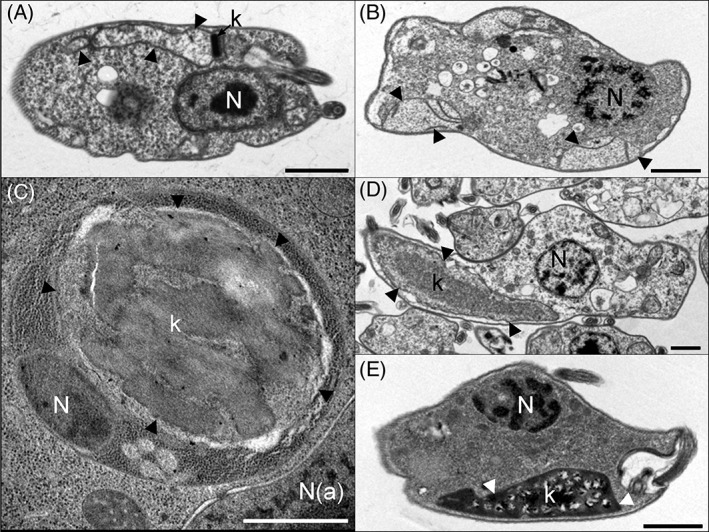
Relative size of the nuclear and mitochondrial DNA‐containing structures in kinetoplastids and diplonemids. Thin section transmission electron microscopy of (A) Trypanosoma brucei, (B) Diplonema papillatum (C) Perkinsela sp. (D) Trypanoplasma borreli and (E) Cryptobia helicis. The mitochondrion is indicated by arrowheads, the kDNA (present in all species except D. papillatium) is indicated by “k,” the nucleus is indicated by “N,” and the host cell nucleus (for Perkinsela sp.) is indicated by “N(a).” Scale bars represent 1 μm.
