Figure 3.

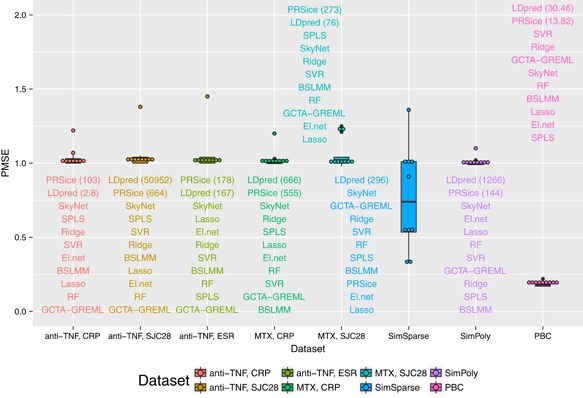
Prediction mean squared error (PMSE; lower values indicate better fit) from the prediction analyses for the 11 methods for all the data sets [Color figure can be viewed at wileyonlinelibrary.com]

Prediction mean squared error (PMSE; lower values indicate better fit) from the prediction analyses for the 11 methods for all the data sets [Color figure can be viewed at wileyonlinelibrary.com]