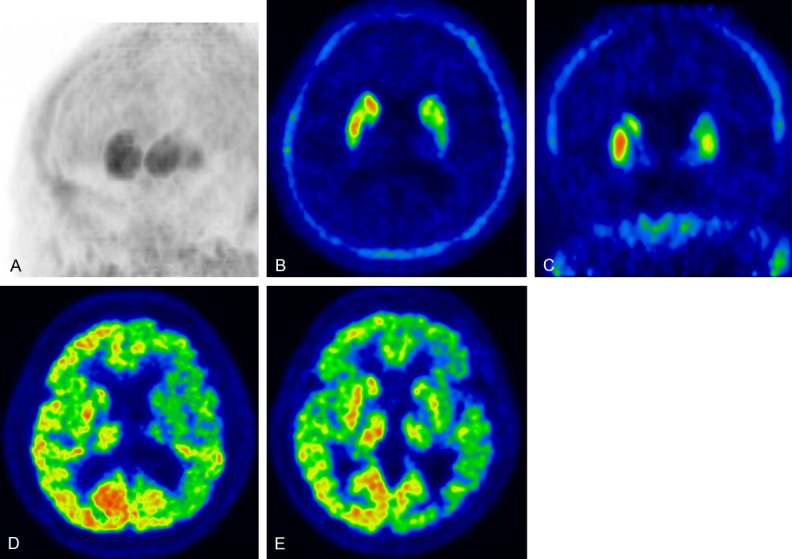
Figure 7.

Corticobasal degeneration (CBD) (A) Maximum intensity projection image of DAT imaging using 18F-FP-CIT showing prominent asymmetricity of the striatum. (B) Transaxial and (C) coronal DAT images showing decreased tracer uptake in the left caudate nucleus and putamen. (D) Early perfusion image of 18F-FP-CIT and (E) glucose metabolism of 18F-FDG showing decreased perfusion and glucose hypometabolism in the left cerebral hemisphere, striatum, and thalamus.
