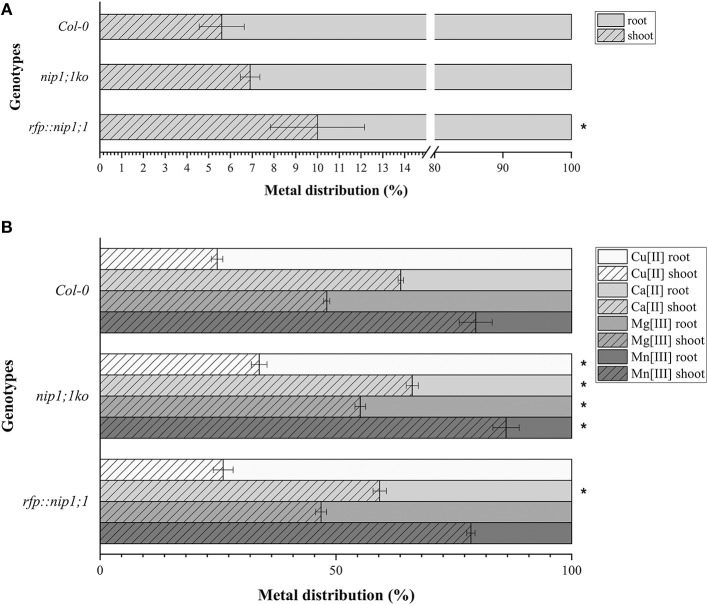
Figure 11.
Distribution, measured by ICP-AES of (A). AS (significance (*) expressed as p = 0.024) and (B) Ca, Cu, Mg, and Mn in the plants: the percentage of metals in the root resulting from direct uptake and the percentage in the shoot due to translocation (significance (*) of difference with Col0 control expressed as p = 0.041). n = 5.

