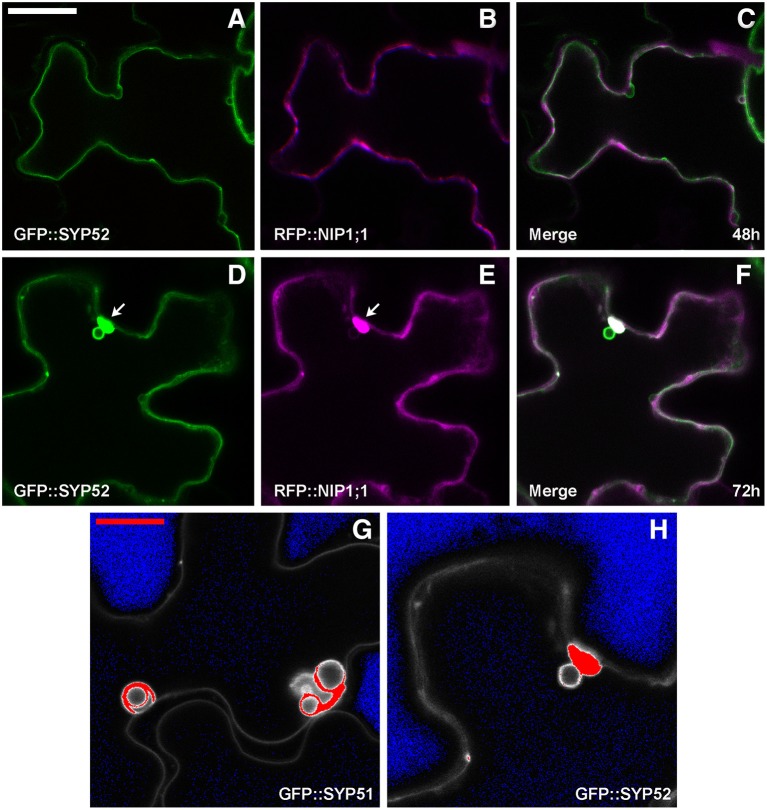
Figure 6.
Epidermal cells' confocal images of Arabidopsis cotyledons, transiently co-expressing RFP::NIP1 with (A–C) GFP::SYP52 for 48 h; (D–F) for 72 h. The first column shows GFP signal in green, the second column shows the RFP signal in magenta whereas the third column shows the overlay of fluorescent signals and co-localization in white. (A–F) Scale bar = 20 μm (panel A). (G,H) Fluorescent signal saturation due to GFP::SYP51 (G) and GFP::SYP52 (H). (G,H) Scale bar = 10 μm (G).

