
Figure 3.
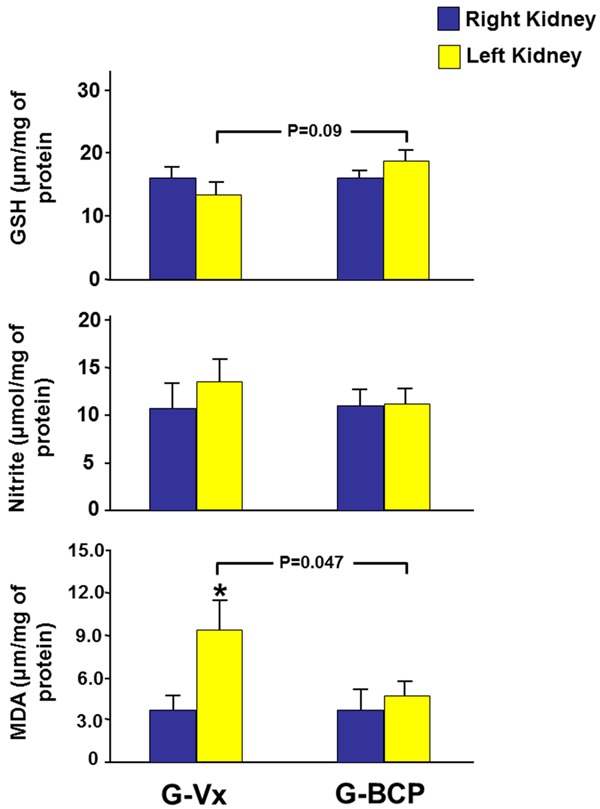
The tissue level of the oxidative stress markers malondialdehyde (MDA), glutathione (GSH) and nitrite in both kidneys in G-Vx and G-BCP. Values represent mean ± SEM. *Indicates statistical significance between the right and left kidney within the same group whereas the bar indicate the level of significance between the left kidneys in both groups.