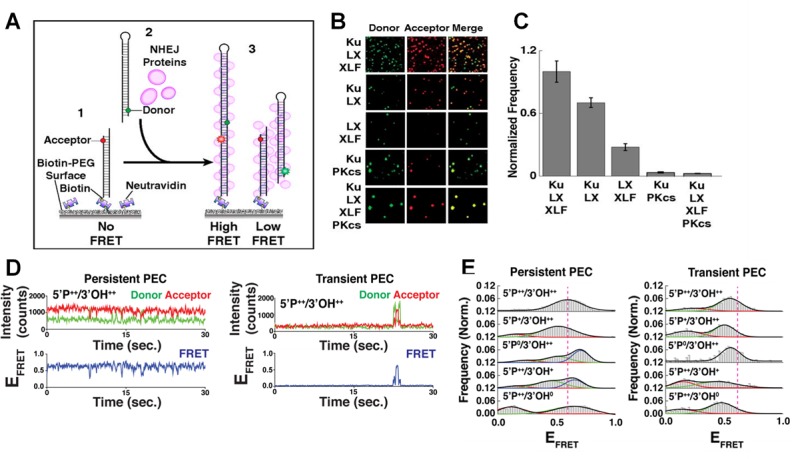
Figure 2. FIGURE 2: smFRET of NHEJ synapsis and ligation.

(A) Schematic of the end joining smFRET assay. (1) dsDNA labelled with an acceptor dye is immobilizes to a PEG surface. (2) NHEJ proteins and a second dsDNA molecule, labelled with a donor, are added to the solution. (3) As the two ends of the DNA are joined together, FRET is observed. (B) Images showing the donor/acceptor channels for experiments that are investigating different combinations of NHEJ proteins. (C) The quantification of the number of spots in end joining experiments, from n>1000 molecules for each condition. Error bars illustrate SEM. (D) Typical smFRET traces for persistent and transient PECs. (E) Frequency distributions for FRET values of persistent and transient PECs observed with various end chemistries of dsDNAs used in the end joining assays. Reproduced from Ried et al. (2015 and 2017) [21, 27].
