Figure 1.

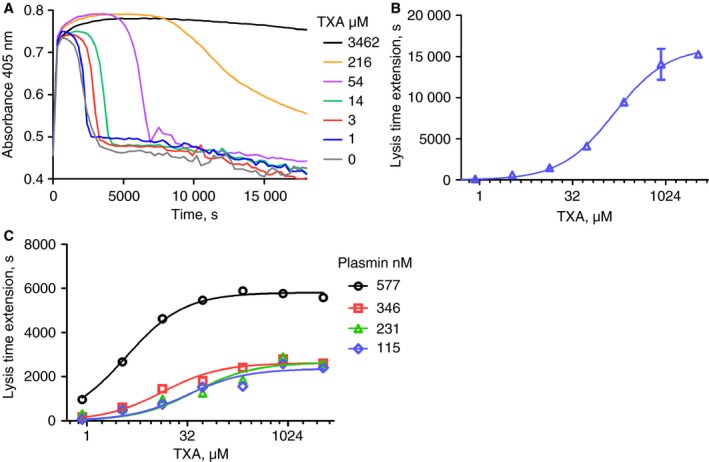
Plasma clot lysis with tissue plasminogen activator (tPA) or plasmin and inhibition by tranexamic acid (TXA). Plasma clots contained 2.5 nmol L−1 tPA or plasmin as shown with a range of TXA concentrations, and times to 50% lysis were determined. Panel A shows representative raw data for clot lysis time‐courses for clots containing 2.5 nmol L−1 tPA. Panel B shows analysis of lysis profiles as extension of time to 50% lysis at each TXA concentration used to calculate an IC50 = 150 μmol L−1 (± 20 μmol L−1 as the standard error [SE] of the fit). Means and standard deviations [SDs] of duplicates are shown. Panel C summarizes lysis extension results as single‐point estimates for clot lysis curves where plasmin has been incorporated into the clots in place of tPA at the concentrations shown. Estimates of IC50 values ranged from 4 to 41 μmol L−1 TXA (SE for fitting was 0.3 μmol L−1 at the lowest KD up to 18 μmol L−1 at the higher IC50 values).
