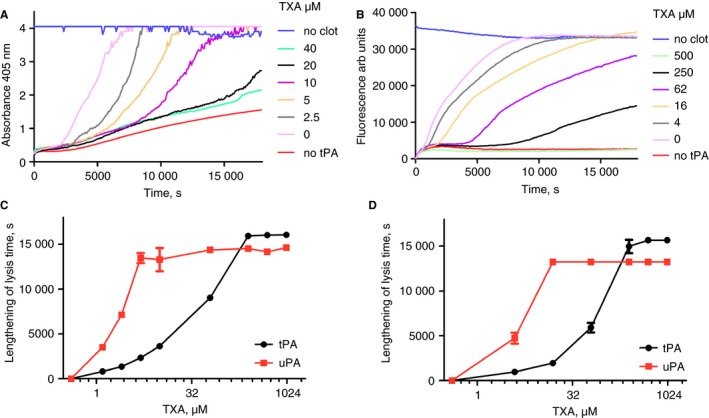
Figure 3.

Clot lysis in the halo format by tissue plasminogen activator (tPA) with blood or plasma showing inhibition by tranexamic acid (TXA). Panel A shows representative blood clot lysis time‐courses for a series of reactions that included 2.5 nmol L−1 tPA and a range of TXA as shown. Panel B is the same arrangements, except clots were made from plasma containing 0.15 mg mL−1 fluorescent fibrinogen. Panels C and D are the corresponding plots for lengthening of 50% lysis time with tPA (circles) or urokinase plasminogen activator (uPA) (squares) at each TXA with concentration in blood (C) and plasma (D), shown as means ± SD of triplicate wells.
