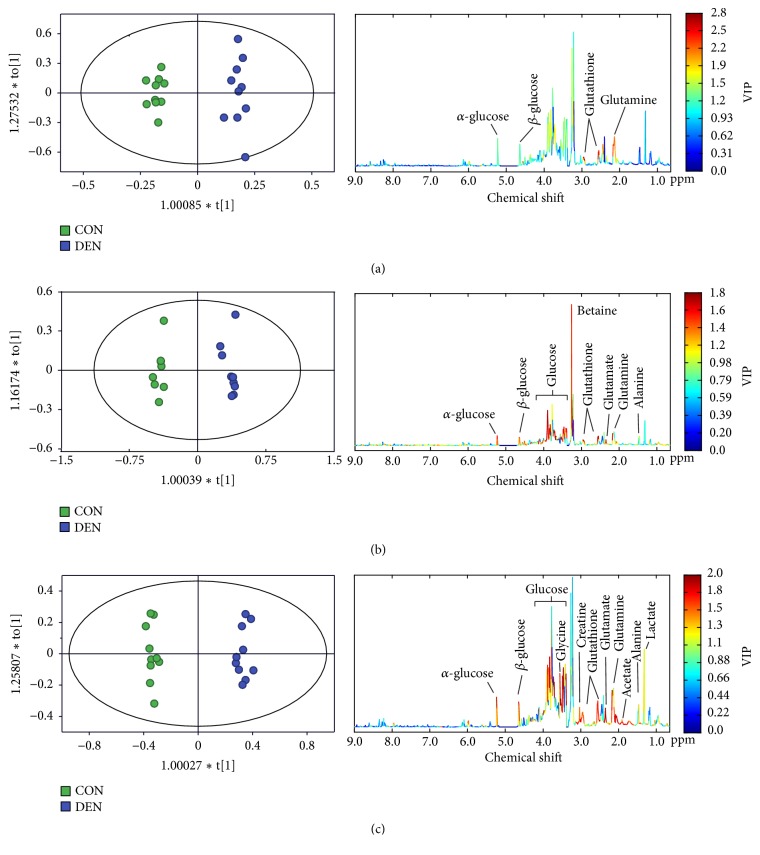
Figure 4.
The OPLS-DA plots and VIP plots obtained from NMR-based hepatic metabolome in the control (green square) and DEN (purple square) groups at the time point of 3 weeks (a), 8 weeks (b), and 15 weeks (c), showing that the energy metabolism (glucose, lactate, and creatine), lipid metabolism (acetate), and amino acid metabolism (alanine, glycine, glutathione, glutamate, and glutamine) were contributed to the changes of metabolic pattern.

