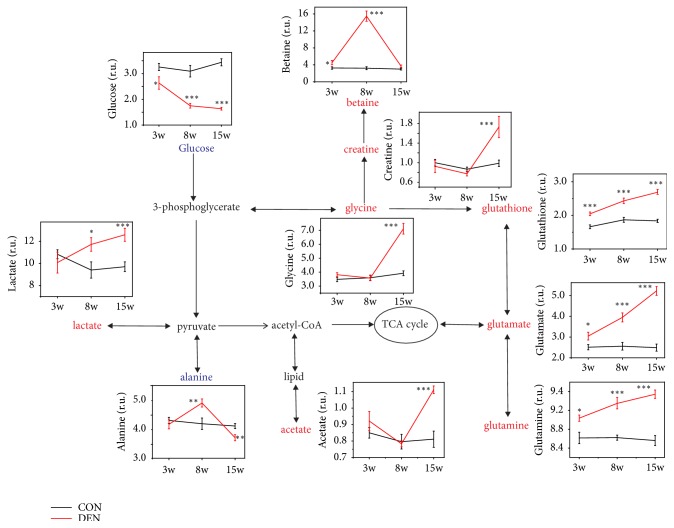
Figure 5.
The metabolic pathways during hepatocarcinogenesis. The pathways based on the KEGG database and HMDB database show the interrelationships of the identified metabolic pathways of the rat liver with or without DEN treatment and the dynamic changes of the metabolites were illustrated in the graphs.

