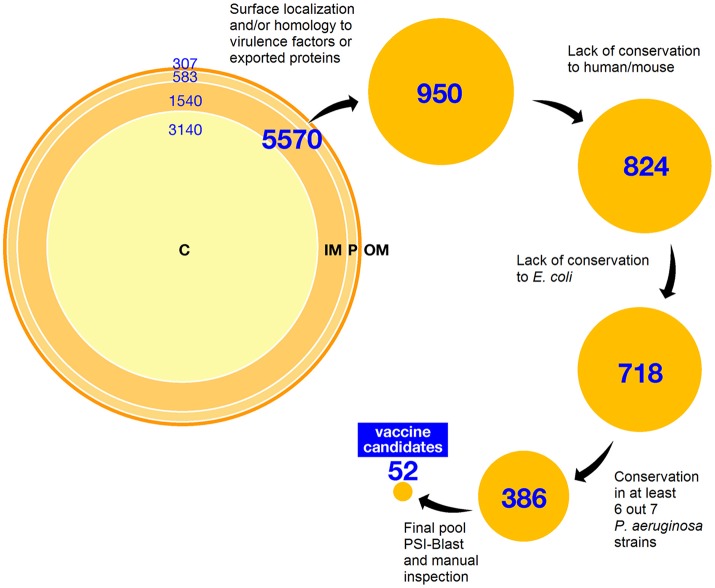
Figure 1.
Schematic workflow of antigen selection in silico. The complete PAO1 proteome has been analyzed as described in the text. Distribution of ORFs according to predicted sub-cellular localization using Psort is summarized at the top. Below, selection steps succession is reported, indicating the number of candidates (hits) selected after each step. C: cytoplasm; IN: inner membrane; P: periplasm; OM: outer membrane.

