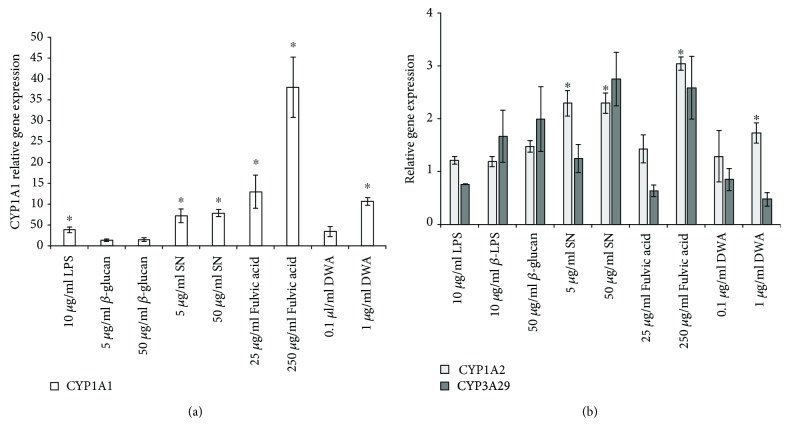
Figure 2.
Relative expression of CYP1A1 (a) and CYP1A2 and CYP3A29 (b) genes in feed additive treated IPEC-J2 cells compared to untreated groups (n = 6/group, ∗ p < 0.05). Data are shown as means ± SEM. LPS: lipopolysaccharide; SN: sanguinarine-containing product; DWA: drinking water acidifier; CYP: cytochrome P450.

