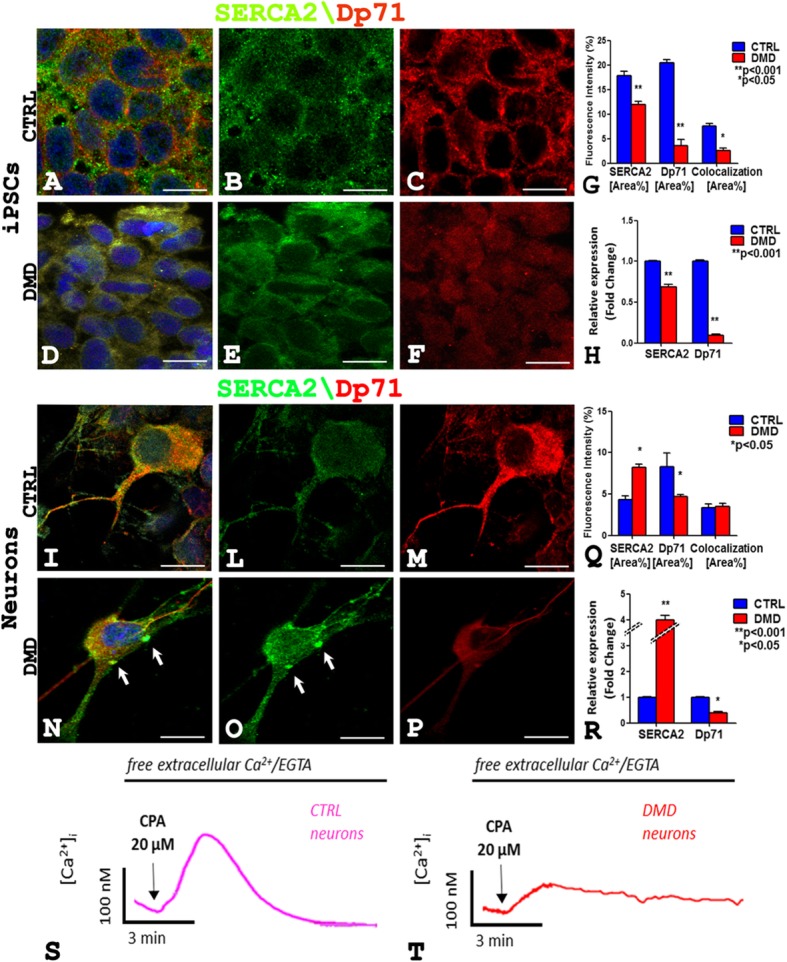
Fig. 4.

SERCA2 (green) and Dp71 (red) fluorescence signals decrease and diffuse in DMD hiPSCs cytoplasms (d–f) compared to intense membrane expression in the control (a–c) while SERCA2 signal increases (o) and DP71 decreases (p) in DMD neurons (n–p) compared to control ones (i–m). An orange fluorescence signal of colocalization for SERCA2 and Dp71 is present in hiPSCs (a, d) and neurons (i, n) of both DMD and CTRL. Note a concentrate point SERCA2 expression (n, o arrow) in DMD neuron. Morphometric analysis (g, q) shows a significative reduction of SERCA2 and Dp71 fluorescence intensity in hiPSCs in DMD (g) and significative SERCA2 increase and DP71 decrease in DMD neurons (q). The mRNA expression analysis (h, r) shows reduction of SERCA2 and Dp71 mRNA in DMD hiPSCs (h) and mRNA SERCA2 increase and DP71decrease in DMD neurons (r) compared to the control. Experiments of ER Ca2+-depletion kinetics show significative reduction of CPA-induced ER Ca2+ release in DMD neurons (t) compared to CTRL neurons (s). Scale bar: a–f, i–p 7.5 μm. Data are represented as mean ± SEM
