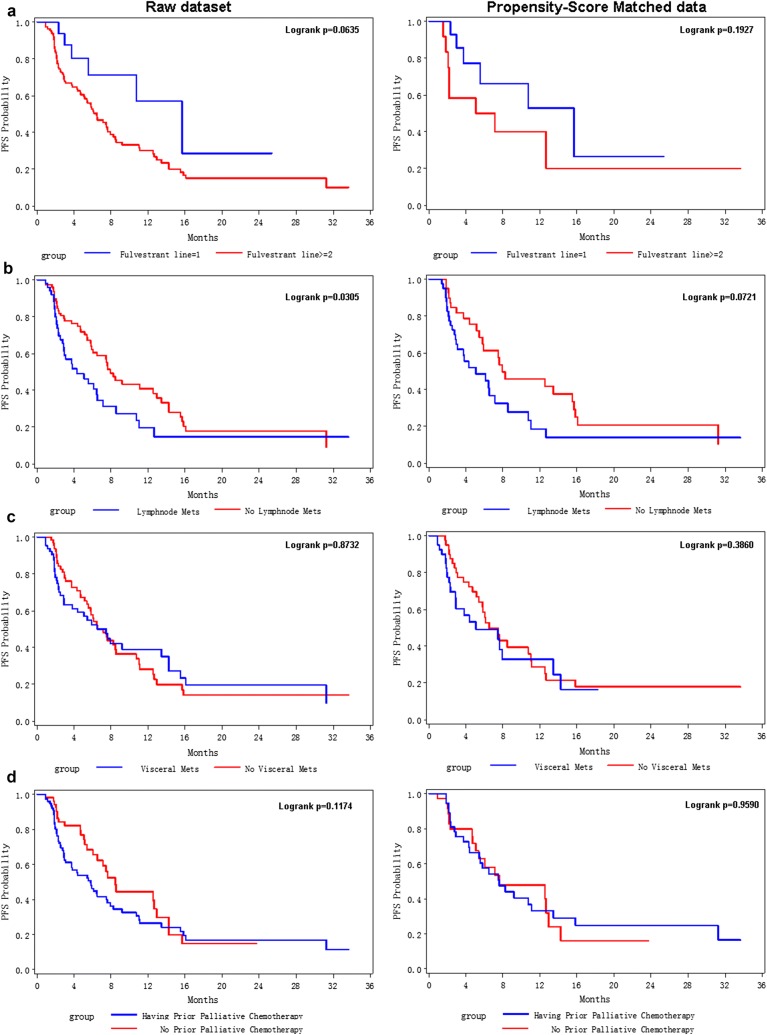
Fig. 2.
Kaplan–Meier curves for progression-free survival probabilities stratified by Fulvestrant lines (a), lymph node metastasis (b), visceral metastasis (c), and prior palliative chemotherapy (d). The left panel was derived from enrolled raw dataset; the right panel showed KM curves for propensity score-matched samples

