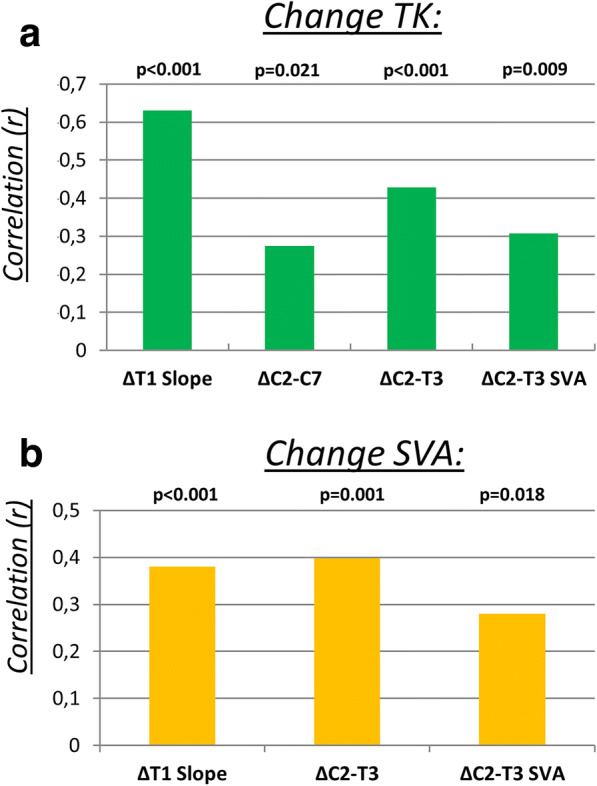
Fig. 3.

a Comparison of subgroups: decreased, stable, and increased thoracic kyphosis (TK) with ΔT1 Slope and ΔC2-T3; p = statistical significance, p < 0.05. b Comparison of subgroups: decreased, stable, and increased sagittal vertical axis (SVA) with ΔT1 Slope, ΔC2-T3, ΔC2-C7 SVA and ΔC2-T3 SVA; p = statistical significance, p < 0.05
