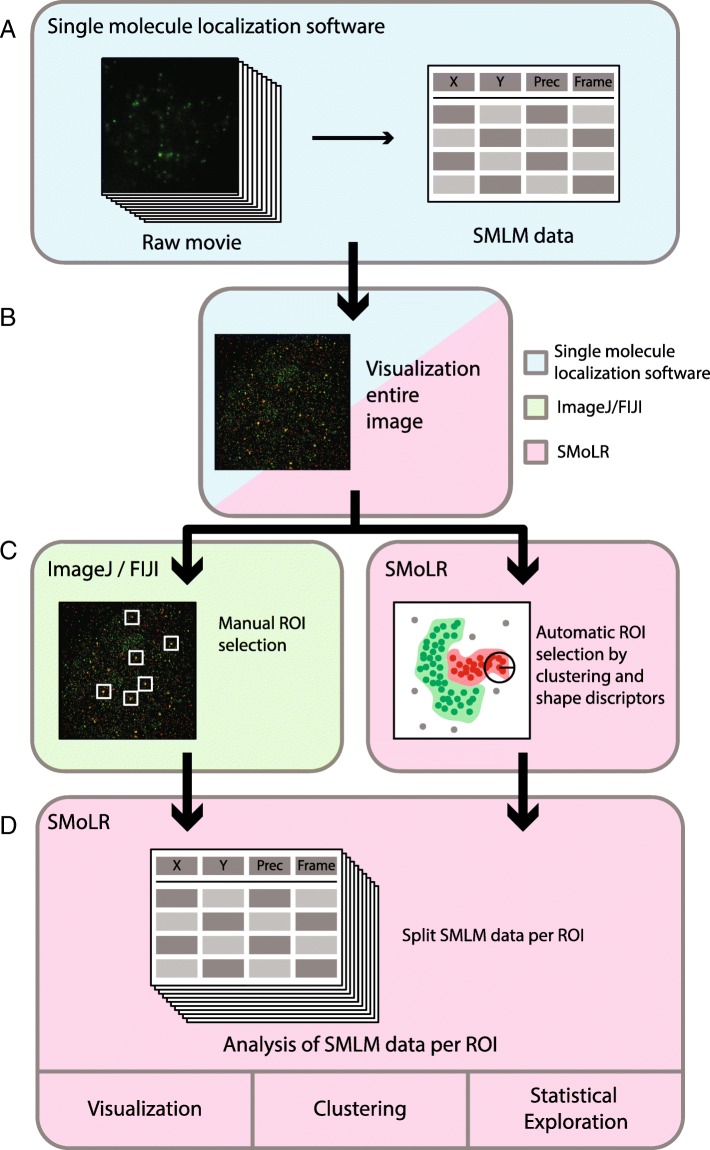
Fig. 1.
Workflow for analysis of SMLM data with SMoLR. Workflow across external single-molecule localization software (blue), ImageJ/FIJI (green) and SMoLR (pink). (a) SMLM data is extracted from microscopy images, and represented in table format with as minimum information x and y coordinates, and localization precision. (b) The extracted data is analyzed with SMoLR or other visualization programs as an entire image. (c) Using either ImageJ/FIJI or SMoLR regions of interest are determined and selected, either manually or automatically using selection criteria. (d) The localization data is split by SMoLR into a list containing data of each ROI, these individual ROIs can be analyzed in more detail at once. Resulting parameters can easily be statistically explored using R

