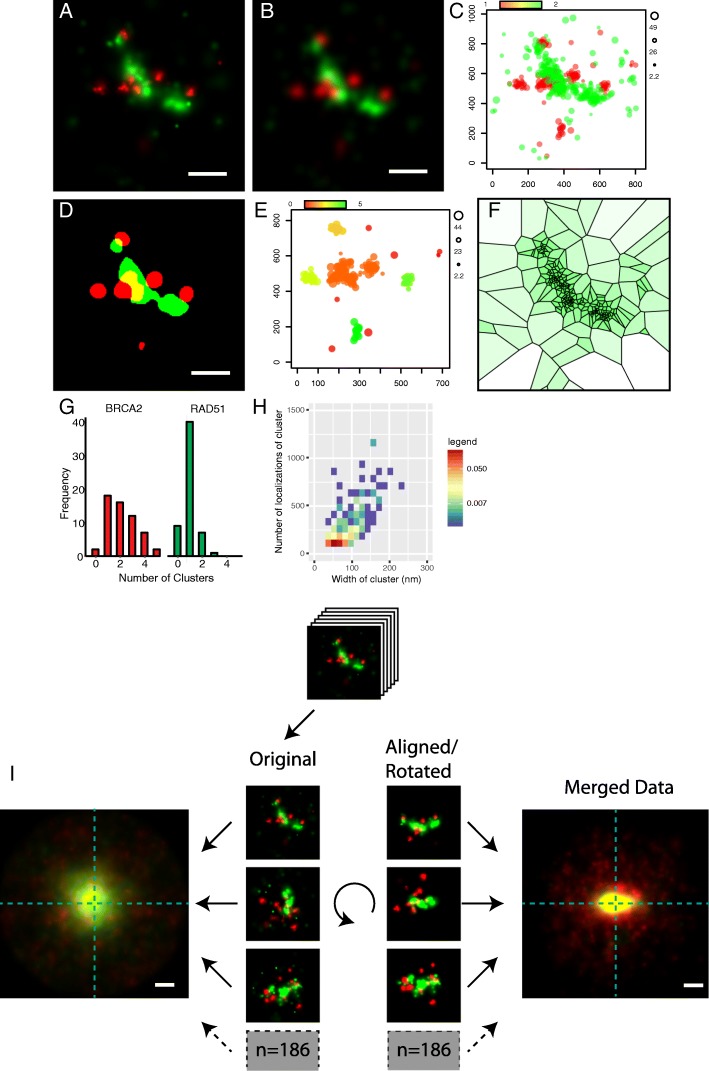
Fig. 2.
Analysis of DSB foci with SMoLR Human (U2Os) cells were indirectly immunostained for RAD51 (Atto488, green) and BRCA2 (Alexa647, red) and imaged by dual color dSTORM. Visualization (a-c), clustering (d-f) and statistical exploration (g-h) as featured in SMoLR is shown. (a) Single DSB foci plotted as Gaussian distributions, (b) kernel density estimation and (c) as an extended scatter plot where the size of the points represents the localization precision. Three clustering algorithms: (d) KDE, (e) DBSCAN and (f) Voronoi tessellation. Clusters are shown in separate colors for KDE and DBSCAN. Voronoi tessellation is depicted with a color intensity that correlates with area of the tiles, hence the local density of localizations. Graphical representations of cluster information: (g) Histogram with the number of clusters per DSB focus for the two proteins, (h) 2D histogram of cluster Size (FWHM) versus number of localizations of the BRCA2 foci. (i) Template free particle averaging of multiple (n = 186) DSB foci; the center and orientation of the RAD51 signal was determined and used to align and rotate the foci. Additionally the foci were oriented in such a way that their highest intensity was at the left side of the merged image. For reference, the crosshair indicated the center of rotation. Scale bars are 200 nm

