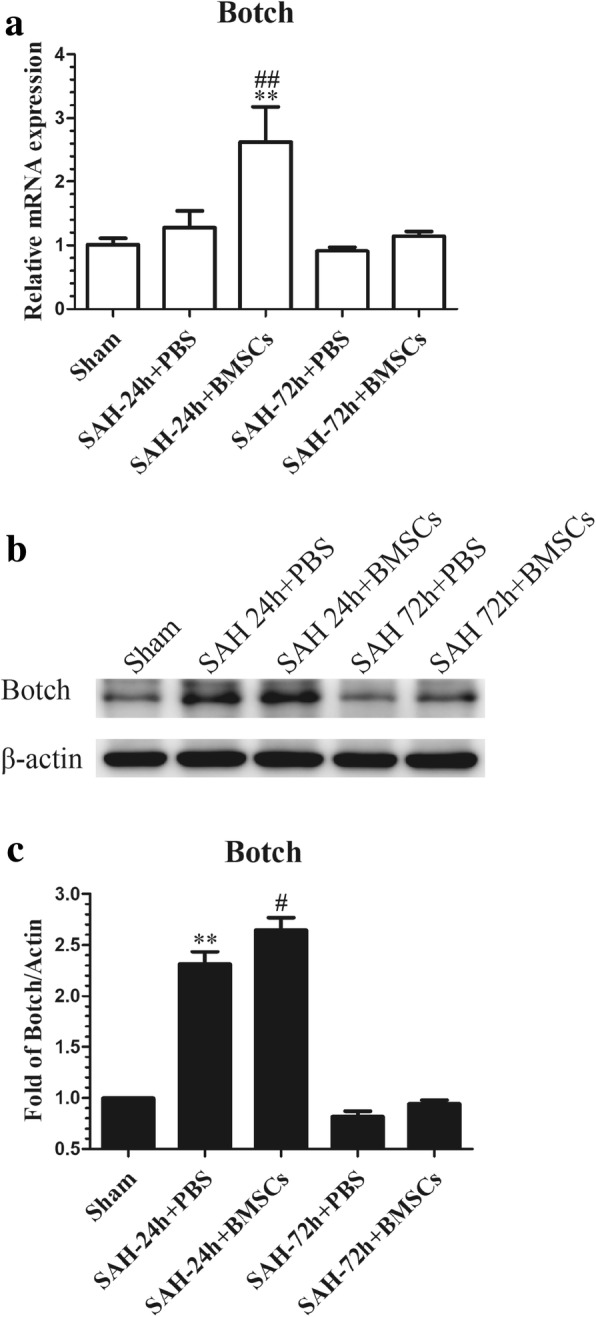
Fig. 10.

Effects of BMSCs treatment on the expression of Botch in brain tissue at 24 and 72 h post-SAH. The qRT-PCR analysis of the Botch mRNA level showed that Botch was upregulated in SAH + BMSCs group compared with SAH + PBS group at 24 h post-SAH (a); n = 3 in each group; data expressed as the mean ± SEM. **P < 0.01 versus Sham, ##P < 0.01 versus SAH + PBS group. Western blot data showed that BMSCs treatment significantly increased the protein levels of Botch in left cortex at 24 h post-SAH (b); n = 6 in each group; data are expressed as the mean ± SEM. **P < 0.01 versus Sham, #P < 0.05 versus SAH + PBS group (c). The qRT-PCR and Western blotting analysis of Botch protein and mRNA levels in the left cortex showed no obvious upregulation in BMSCs treatment group at 72 h post-SAH
