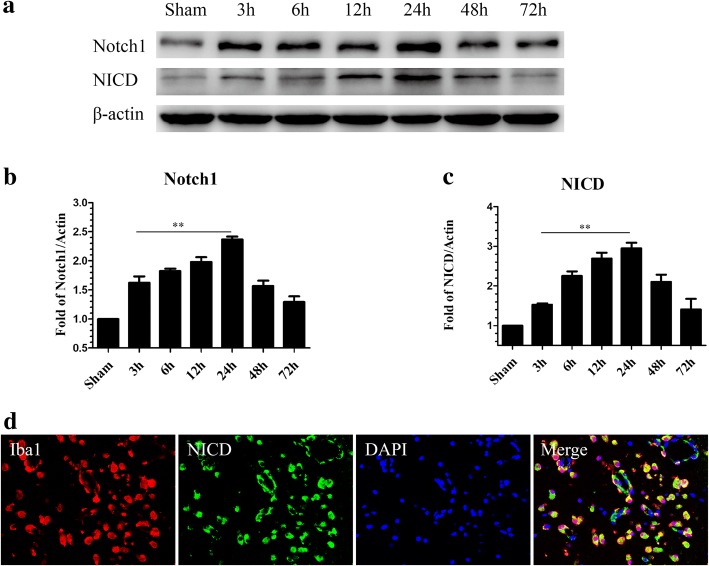
Fig. 4.
Time course of Notch1 and NICD expression in the left cortex after SAH. Representative images of Western blot data showing that endogenous Notch1 and NICD began to increase at 3 h and reached their highest expression at 24 h post-SAH (a). Quantification of Notch1 (b) and NICD (c) expression in the left cerebral cortex after SAH; n = 6 in each group; data are expressed as the mean ± SEM. **P < 0.01 versus Sham. Representative images of double immunofluorescence staining for NICD and Iba1 showing the co-localization of NICD with Iba1-positive microglia (d) in the left cerebral cortex at 24 h post-SAH. Scale bar = 50 μm. NICD Notch1 intracellular receptor domain

