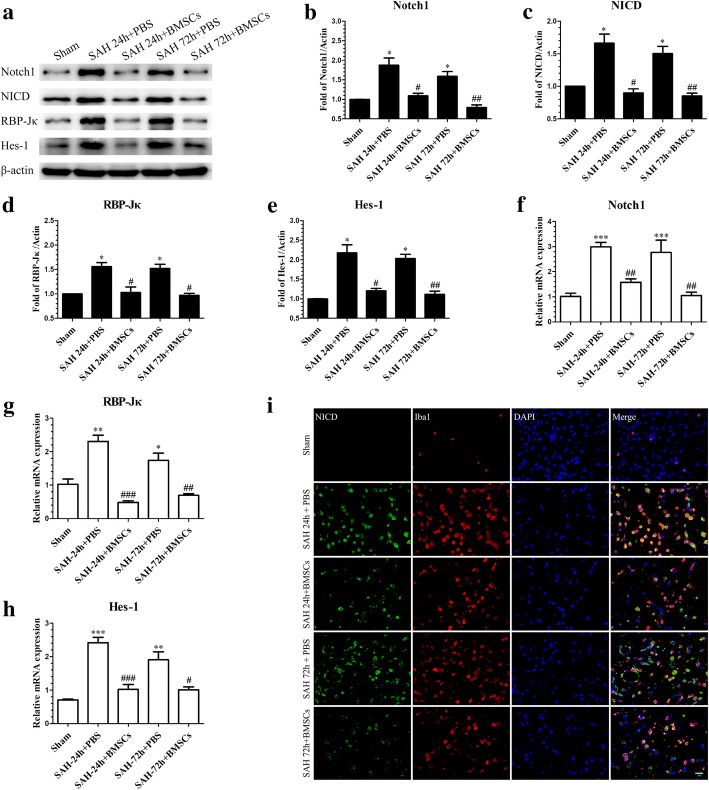
Fig. 9.
BMSCs transplantation inhibited SAH-induced upregulation of the Notch1 pathway-related molecules, Notch1, NICD, RBP-Jκ, and Hes-1 at 24 and 72 h post-SAH. Representative image of Western blotting (a) and quantification of Notch1 (b), NICD (c), RBP-Jκ (d), and Hes-1 (e) protein levels after BMSCs treatment at 24 and 72 h post-SAH; n = 6 in each group; data are expressed as the mean ± SEM. *P < 0.05 versus Sham, #P < 0.05, ##P < 0.01 versus SAH+ PBS group. The qRT-PCR analysis of Notch1 (f), RBP-Jκ (g), and Hes-1 (h) mRNA levels at 24 and 72 h post-SAH; n = 3 in each group; data are expressed as the mean ± SEM. *P < 0.05, **P < 0.01, ***P < 0.001 versus Sham, #P < 0.05, ##P < 0.01, ###P < 0.001 versus SAH + PBS group. Typical images of double-immunofluorescence staining for NICD and Iba1 (i) showing that BMSCs treatment suppressed NICD expression in Iba1-positive microglia at 24 and 72 h post-SAH. Scale bar = 50 μm

