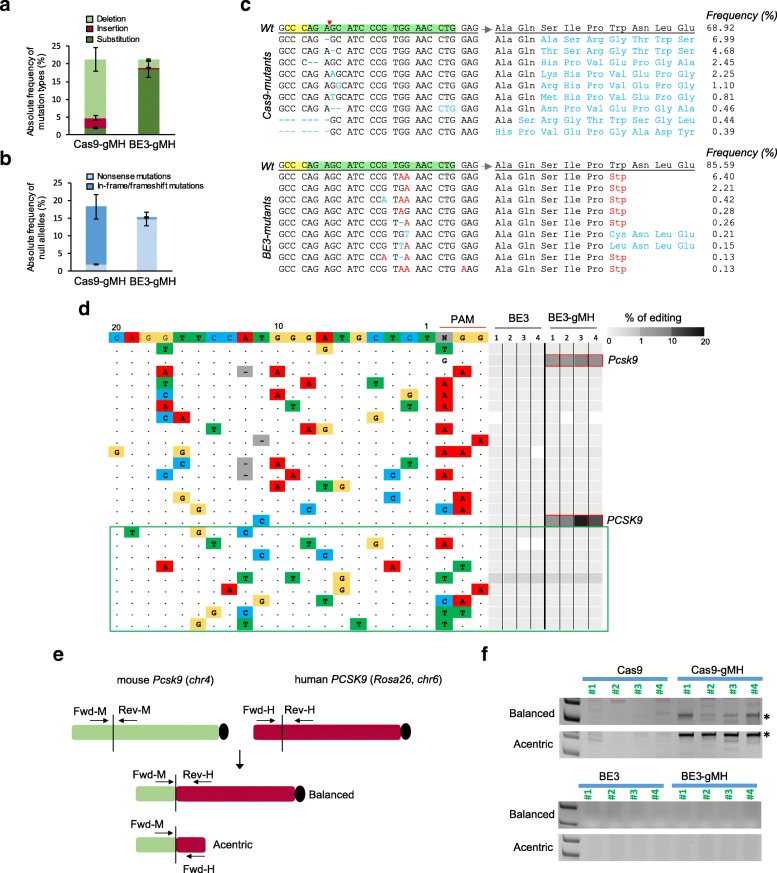
Fig. 4.
In vivo comparison of Cas9 and base editor mutagenic effects in hPCSK9-KI mice. Ten-week-old hPCSK9-KI mice were transduced with adenoviral vectors encoding Cas9-gMH or BE3-gMH. Genomic DNA from mouse liver was analyzed by deep sequencing (a–d) and PCR (f) 3 weeks after treatment. Absolute frequency of (a) mutation types and (b) null alleles in hPCSK9-KI mice treated with Cas9-gMH (n = 6) or BE3-gMH (n = 8). c Representative alignments of Cas9- and BE3-induced mutant alleles and their corresponding predicted protein sequences. Protospacer adjacent motif and gMH sequence are highlighted in yellow and green, respectively. The red arrowhead indicates Cas9 cutting site. d Analysis of 15 off-target sites previously identified for Cas9-gMH by CIRCLE-seq [41] and 9 off-target sites predicted bioinformatically (boxed in green). Mutation frequencies determined by amplicon seq are presented as heat maps for the mouse Pcsk9 on-target site and the 24 off-targets, including human PCSK9. For each site, mismatches relative to the on-target site are shown as colored boxes and bases in the spacer sequence are numbered from 1 (most PAM-proximal) to 20 (most PAM-distal). Each box in the heatmap represents a single sequencing experiment. Sites that were significantly different between groups treated with BE3-gMH and BE3 alone are highlighted with a red outline around the boxes (n = 4 per group). e Schematic of balanced and acentric inter-chromosomal translocations occurring between the mouse Pcsk9 locus and the human PCSK9 locus. f PCR on genomic DNA from liver tissue of hPCSK9-KI mice treated with Cas9-gMH or BE3-gMH (and Cas9-GFP and BE3 as controls) was amplified to assess for translocation events. A PCR band of 327 bp or 492 bp (indicated by *) can only be amplified if a translocation (balanced or acentric, respectively) between the mouse Pcsk9 locus and the human PCSK9 locus has occurred

