Fig. 2.
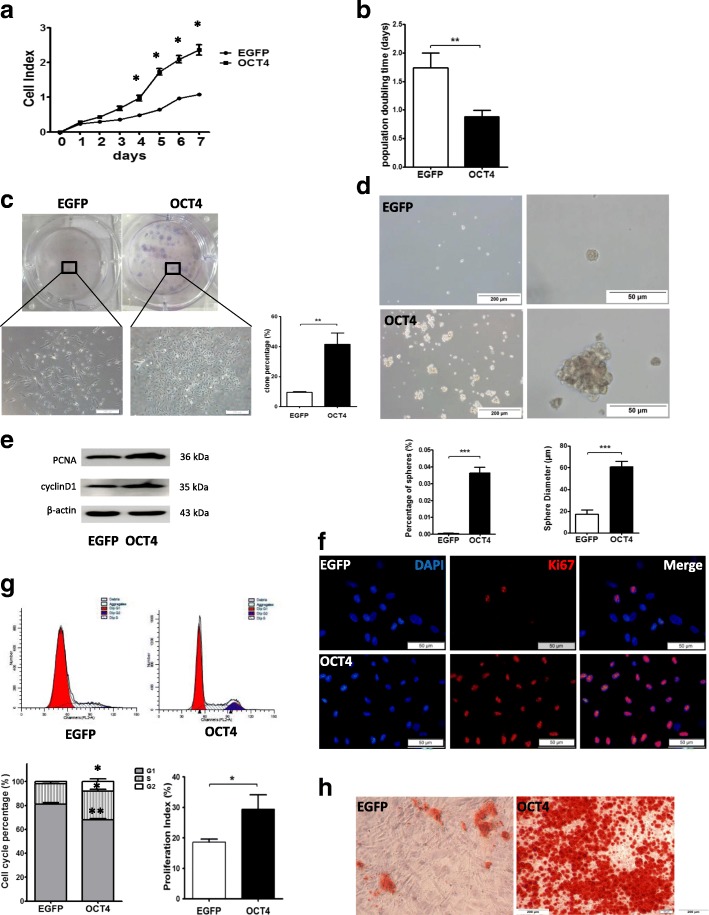
OCT4 increased proliferation capacity and differentiation potential in hHFMSCs. Cell proliferation curve (a) and cell population doubling time (b) of hHFMSCsEGFP and hHFMSCsOCT4. c Clone formation assay of hHFMSCsEGFP and hHFMSCsOCT4; the enlarged views show the difference between the two cell clones. The histogram is the formation rate for each clone (bar, 200 μm). d Representative sphere images and bar graph of the percentages of spheres in hHFMSCsEGFP and hHFMSCsOCT. e Western blot results for the expression of proliferation-associated proteins PCNA and cyclin D1 in hHFMSCsEGFP and hHFMSCsOCT4. f Immunofluorescence of proliferation-associated protein Ki67 expression and location in hHFMSCsEGFP and hHFMSCsOCT4 (bar, 50 μm). g Effects of OCT4 on hHFMSC cell cycle phase distribution. The percentage of the G1, G2, and S phase in the cell cycle (left of the lower panel) and the PI (right of the lower panel) of the hHFMSCsEGFP and hHFMSCsOCT4. “dip” is the abbreviation for diploid. h Osteogenic differentiation in hHFMSCsEGFP and hHFMSCsOCT4. Calcium nodules were detected by Alizarin Red S staining (bar, 200 μm). (*p < 0.05; **p < 0.01; ***p < 0.001)

