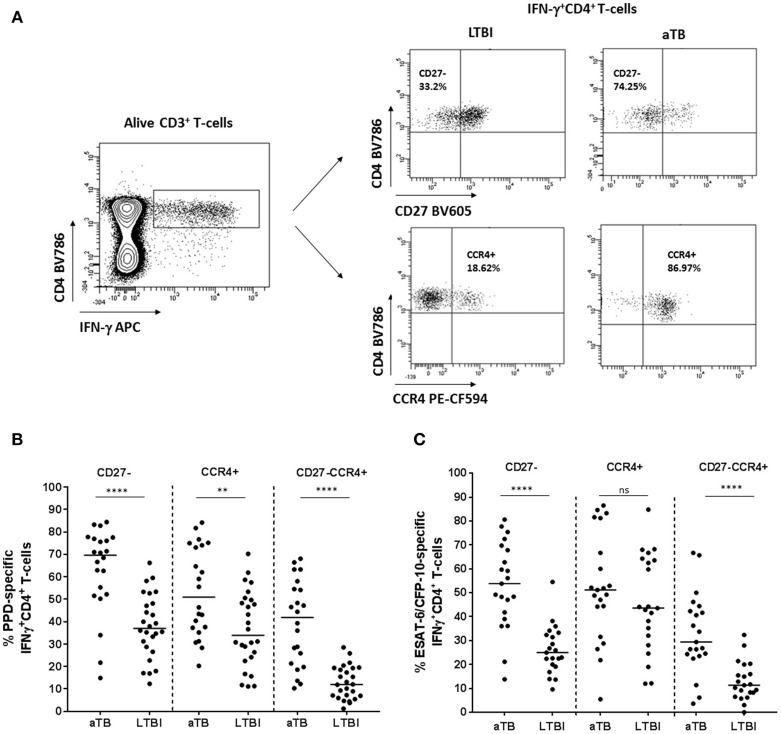
Figure 2.
CD27− and/or CCR4+ phenotype from CD4+IFN-γ+ specific T-cells in patients with active TB and LTBI individuals. (A) Representative example from an active TB and a LTBI individual showing the strategy for determining CD27− or CCR4+ T-cells after PPD stimulation. CD27 and CCR4 expression was analyzed within the specific IFN-γ+CD4+ T-cells population after PPD or ESAT-6/CFP-10 stimulation. A negative control without stimulation was also included in the analysis for each patient enrolled in the study. Fluorescence Minus One (FMO) controls were included in each experiment for setting up gates. (B) Percentage of PPD or (C) ESAT6/CFP10 specific CD27−, CCR4+, and CD27−CCR4+ within IFN-γ+CD4+ specific T-cells. Horizontal lines represent medians. Differences between conditions were calculated using the two-tailed Mann-Whitney U-test. **p < 0.01, ****p < 0.0001. ns, non-significant. aTB, active TB; LTBI, latent tuberculosis infection.

