. 2018 Oct 30;8(1):101–111. doi: 10.1039/c8tx00238j

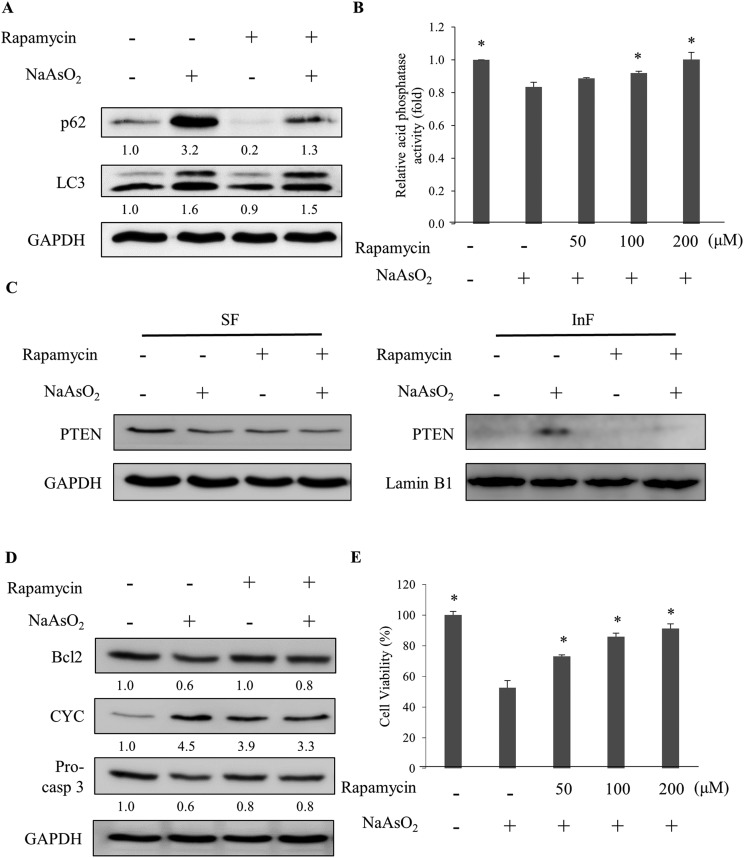
Fig. 5. Rapamycin activates autophagy which is blocked by arsenite treatment. (A) HEK293 cells were treated with NaAsO2 in the presence of 100 nM rapamycin. The levels of p62 and LC3 were determined. (B) Cells were treated with NaAsO2 in the presence of various concentrations of rapamycin and the acid phosphatase activities were analyzed. (C) Cells were treated with arsenite in the presence of 100 nM rapamycin. The soluble (SF) and insoluble (InF) fractions of arsenite-treated cells were separated and the PTEN levels were analyzed by immunoblotting. (D) Cells were treated with NaAsO2 in the presence of 100 nM rapamycin. Bcl2, cytochrome c (CYC), and pro-caspase 3 (Pro-casp 3) levels were determined by immunoblotting. (E) Viability of the arsenite-treated cells in the presence of various concentrations of rapamycin. Rapamycin was administered to cells 30 min before the addition of 20 μM NaAsO2 and incubated for 24 h. Each value (B and E) represents a mean ± standard deviation of three independent samples. Asterisks indicate significant differences as compared to that of cells treated only with NaAsO2. *p < 0.05. GAPDH was used as a loading control to normalize the amount of the sample applied for analysis (A, C and D). Numbers underneath the western blotting represent the amount of p62 or LC3 relative to that of the loading control.

Fig. 5