
Figure 1.
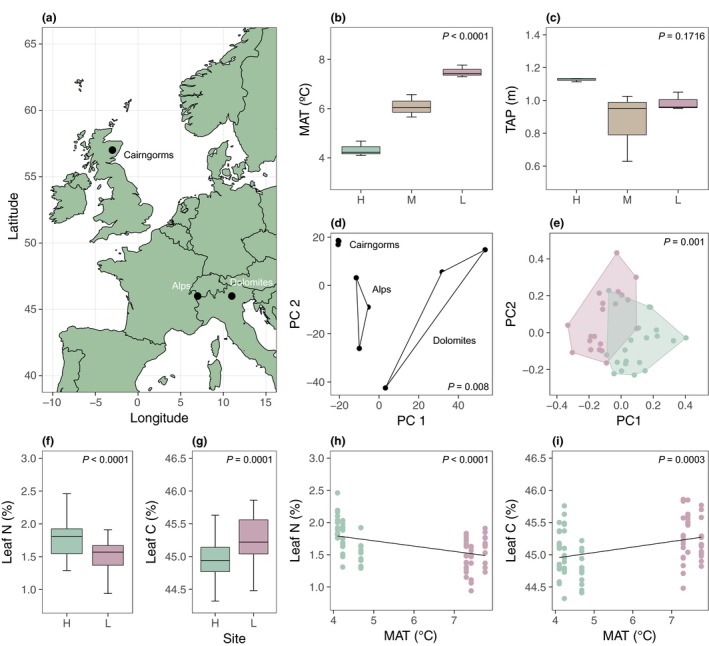
Locations and characteristics of elevation gradients. (a) Elevation gradients were established in three European mountain areas supporting populations of E. vaginatum. (b and c) Boxplots showing (b) mean annual temperature (MAT; °C) and (c) total annual precipitation (TAP; cm) for high (H, high), mid (M, orange) and low (L, red) elevation sites. (d) PCs 1 and 2 from a PCA of SNP allele frequencies grouped by mountain area. (e) PCs 1 and 2 from a PCA of plant phenotypes for high (green) and low (red) elevation populations on one gradient. (f and g) Boxplots showing (f) leaf nitrogen and (g) leaf carbon contents (%) for high (green) and low (red) elevation populations in all mountain areas. (h and i) Scatter plots showing (h) leaf nitrogen and (i) leaf carbon (%) against (h) MAT (°C) and (i) TAP (cm) using high (green) and low (red) elevation populations from all mountain areas. For (b–d), P‐values indicate significance of differences between displayed groups (see Appendix S5).