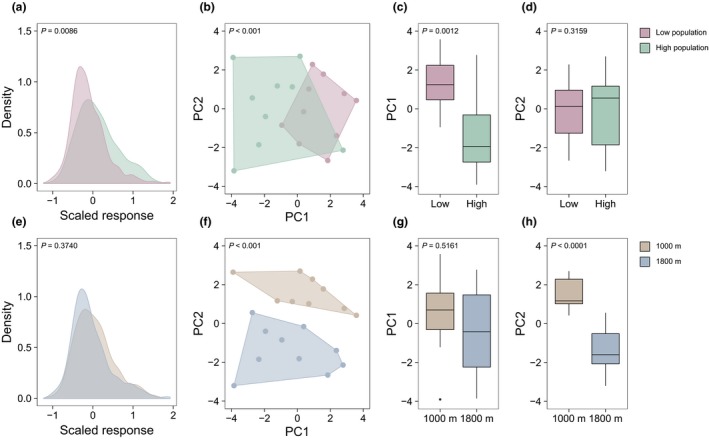
Figure 2.

Warming effects on E. vaginatum primary metabolism. Effects of (a–d) source population (green, high elevation population; purple, low elevation population) and (e–h) planting elevation (brown, 1000 m; blue, 1800 m) on (a and e) the activity of the primary metabolism (density plots of all standardised peak areas), (b and f) variation within the primary metabolism (plots of PCs 1 and 2 from a PCA considering all primary metabolites), (c and g) variation within PC1 and (d and h) variation within PC2. In all cases, P‐values indicate significance of differences between displayed groups (see Appendix S5).
