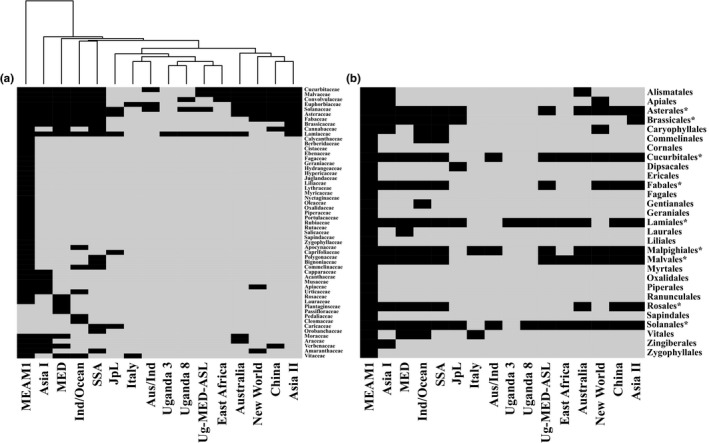
Figure 1.

The presumed diet breadth of species groups in the Bemisia tabaci complex. Data from Supporting Information Table S1 were used as input for the heatmap.2 function of the r gplots package (R Core Team, 2015). (a) The dendrogram clusters (UPGMA clustering of euclidean distances) the different B. tabaci species into four groups according to their botanical families host range. (b) Mapping the data to the host plant orders allows the identification of nine orders (indicated with asterisks) that are commonly shared by most B. tabaci species. Names of B. tabaci species are displayed according to that of panel (a) for comparative purposes
