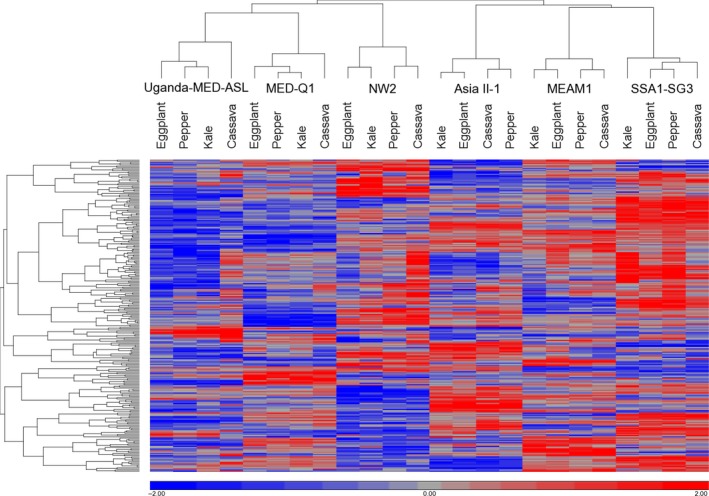
Figure 3.

Heat map showing summary of the mean expression patterns of detoxification genes significantly regulated in adults of the six analysed Bemisia tabaci species after feeding for 24 hr on the common host plant eggplant or the noncommon host plants: kale, cassava and pepper. Red represents upregulation, and blue represents downregulation (standardization was made on rld values for each gene across all 24 species and plant combinations). Two‐way clustering of genes and samples was performed applying hierarchical clustering using Pearson's dissimilarity for distance measure and complete linkage method for clustering [Colour figure can be viewed at wileyonlinelibrary.com]
