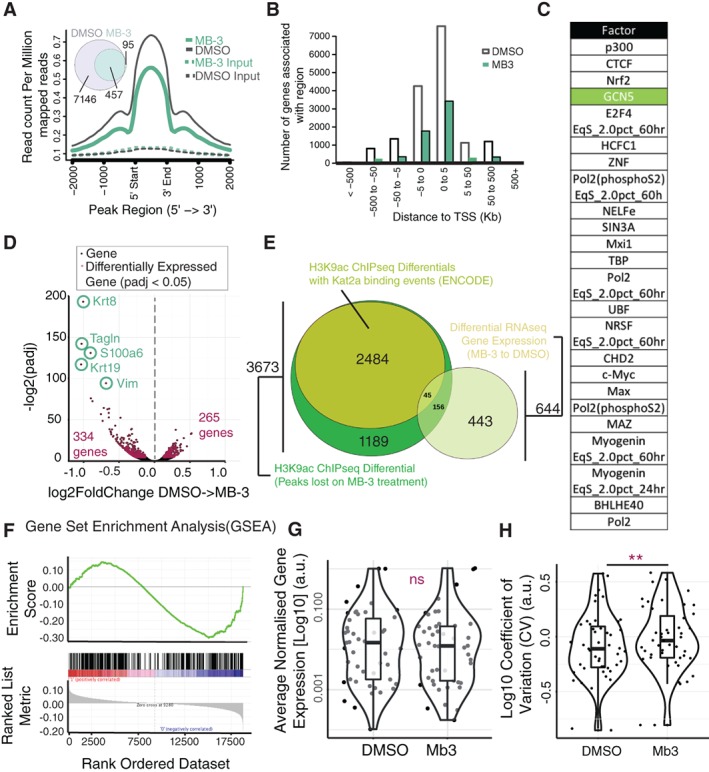
Figure 1.

Effects of Kat2a inhibition on H3K9ac and transcriptional heterogeneity of mouse embryonic stem (ES) cells. (A): MB‐3 treatment of TNGA mouse ES cells results in specific loss of H3K9ac. Height and number (DMSO: 11724; MB‐3: 4673, 98% overlap) of H3K9ac peaks are significantly reduced after 2 days of MB‐3 treatment. (B): H3K9ac marks associated with TSS maintain their location profiles following MB‐3 treatment but reduce in number. (C): Transcription factor binding sites associated with genes that display reduced H3K9ac following MB‐3 treatment include GCN5/Kat2a. List represents transcription factors with Q‐value equal to 0, ordered by proportion of observed H3K9ac differential genes to total number of binding site‐associated genes. (D): RNA‐seq analysis of TNGA mouse ES cells treated with MB‐3 for 2 days. Volcano plot highlighting differentially expressed genes (red dots: adjusted p‐value <.05). (E): Differentially expressed genes partially overlap with H3K9ac gene‐associated peaks lost on MB‐3 treatment. (F): Gene set enrichment analysis of Kat2a direct targets in mouse ES cells among MB‐3 down‐regulated genes (ES = −0.30, NES = −1.34; p value = .005). The negative enrichment score of direct targets (top panel) along the differential RNA‐seq dataset ordered by rank (bottom panel) reveals that it is the down‐regulated genes on MB‐3 treatment that are most enriched for Kat2a direct targets. (G): Quantification of mean gene expression from Single‐cell quantitative reverse transcription polymerase chain reaction (scRT‐qPCR) from cells treated with DMSO or MB‐3. There is no significant difference in mean gene expression between these conditions (Student's t test, p > .05). (H): CV of genes following scRT‐qPCR shows increase in CV on MB‐3 treatment (Student's t test, p < .01). Abbreviations: CV, coefficient of variation; DMSO, dimethyl sulfoxide; GSEA, gene set enrichment analysis; TSS, transcriptional start sites.
