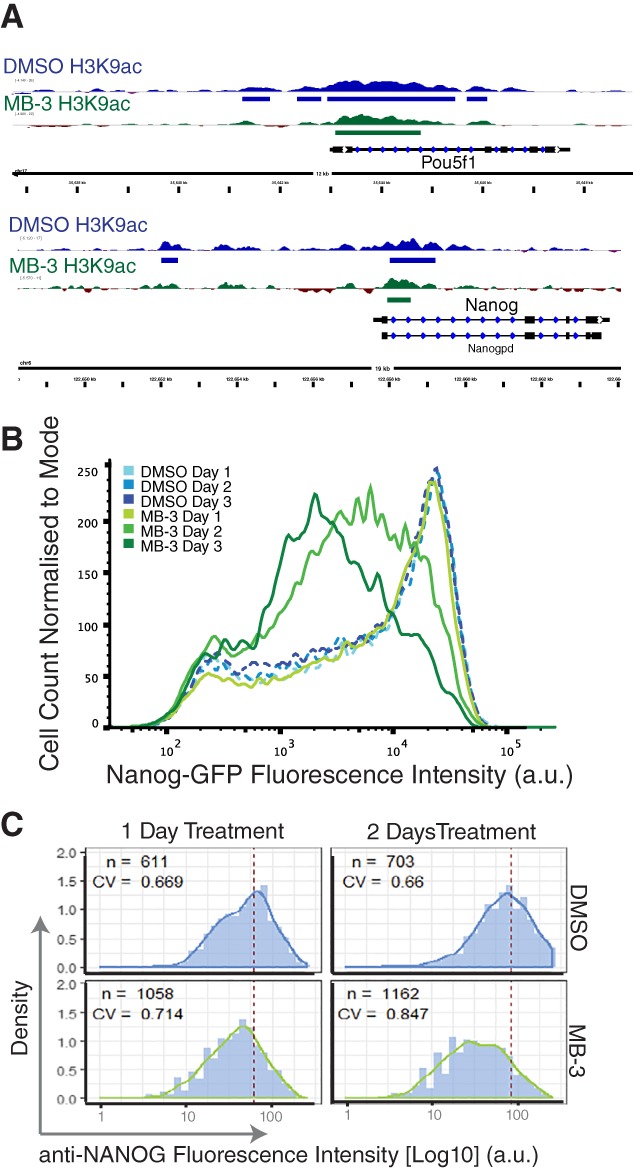
Figure 2.

Effect of Kat2a inhibition on Nanog transcriptional heterogeneity. (A): Chromatin immunoprecipitation analysis of H3K9 acetylation at the Pou5f1 (top) and Nanog (bottom) loci, showing reduction in height and peak width/number upon MB‐3 treatment. There is specific loss of H3K9ac at the Pou5f1 promoter immediately upstream of exon E1 included in the pluripotency‐associated Oct4a transcript and protein isoform 29. (B): Flow cytometry analysis of heterozygous GFP expression from the Nanog locus in TNGA cells upon 1–3 days of MB‐3 treatment; data representative greater than five independent observations. (C): Equivalent increase in heterogeneity observed in wildtype E14tg2A cells stained with NANOG antibody (see Supporting Information Methods for quantification details). Abbreviations: CV, coefficient of variation; DMSO, dimethyl sulfoxide; GFP, green fluorescent protein.
