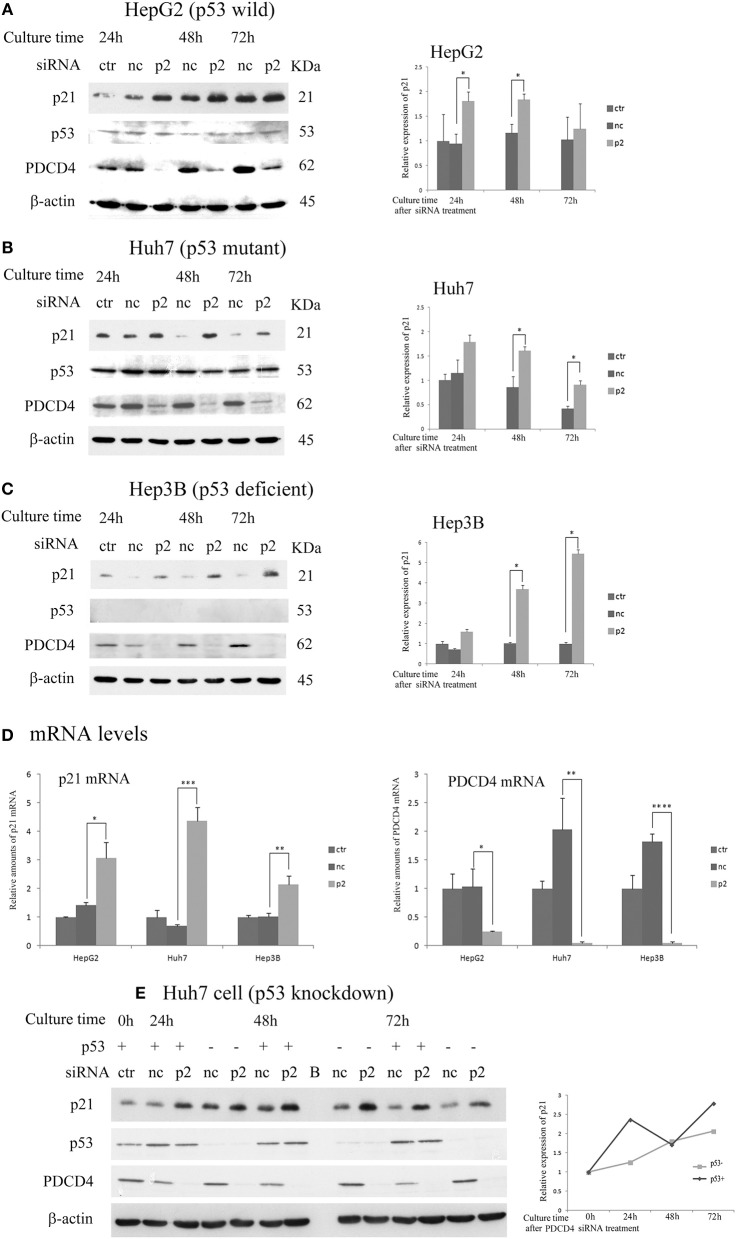
Figure 3.
PDCD4 knockdown up-regulated the expression of p21 in HepG2, Huh7, and Hep3B cells. The experiments were performed as in Figure 2. A Western blot analysis of the untreated cells (ctr), negative control siRNA-treated cells (nc), and p2 siRNA-mediated PDCD4 knockdown cells (p2), were performed using antibodies against p21, p53, PDCD4 and β-actin. (A–C) Western blotting (Left) and a diagram of the relative p21 expression obtained from the Western blot (Right) of cell extracts obtained from (A) HepG2, (B) Huh7 and (C) Hep3B cells. The experiments were independently repeated 3 times, and the p21 expression was normalized to β-actin. The data in the diagrams represent the mean ± SD obtained from the experiments. t-test: * p < 0.05. (D) A real time RT-PCR analysis of p21 in PDCD4 knockdown HepG2, Huh7, and Hep3B cells. The cells were treated with negative control siRNA (nc) or PDCD4-specific p2 siRNA (p2) and cultured for 48 h. The experiments were repeated independently 3 times. Data were expressed as the mean ± SD obtained from the experiments. t-test: *p < 0.05; **p < 0.005;***p < 0.0005; ****p < 0.00005. (E) The p21 expression in p53 knockdown Huh7 cells. The cells were transfected with negative control siRNAs (p53+) or p53-specific siRNAs (p53-). After 24 h, the transfected cells were again treated with negative control siRNA (nc) or PDCD4-specific p2 siRNA (p2). (left panel) Western blotting of Huh7 cells using antibodies against PDCD4, p21, p53 and β-actin at 24, 48, and 72 h after PDCD4 knockdown. (Right) The relative p21 expression in Huh7 cells with and without p53 obtained from the left panel is shown. The amounts of p21 were normalized to β-actin, and the amounts of p21 in the PDCD4 knockdown cells (p2) were expressed as the relative amount compared to the negative control siRNA-treated cells (nc).

