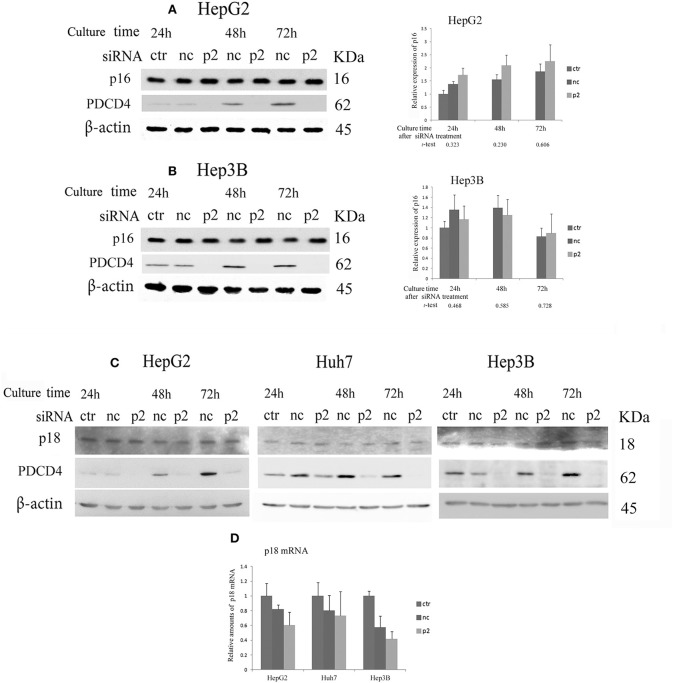
Figure 5.
The expression of the INK4 inhibitors p16 and p18 in PDCD4 knockdown cells. Cells were treated with negative control siRNA (nc) or PDCD4-specific p2 siRNA (p2) and subjected to a Western blotting analysis with p16-, p18-, PDCD4-, and β-actin-specific antibodies after culturing for the times indicated in the figures. (A,B) A Western blot analysis (Left) and diagrams of the relative p16 expression (Right) obtained from the Western blot in (A) HepG2 and (B) Hep3B cells. The experiments were repeated independently three times. The data in the diagrams represent the mean ± SD obtained from the three experiments. (t-test: p-values determined by Student's t-test from the p16 amounts in p2 and nc). The p-values show that the difference in the p16 expression between PDCD4 knockdown cells and negative control cells was not significant. (C) The p18 levels were not markedly changed by PDCD4 knockdown in HepG2, Huh7, and Hep3B cells. These experiments were repeated at least three times, and similar results were obtained each time. ctr, control cells without treatment with siRNAs; nc, negative control siRNA-treated cells; and p2, PDCD4-specific p2 siRNA-treated cells. (D) A real time RT-PCR analysis of p18 in PDCD4 knockdown HepG2, Huh7, and Hep3B cells. The cells were treated with negative control siRNA (nc) or PDCD4-specific p2 siRNA (p2) and cultured for 48 h. The experiments were repeated independently 3 times.

