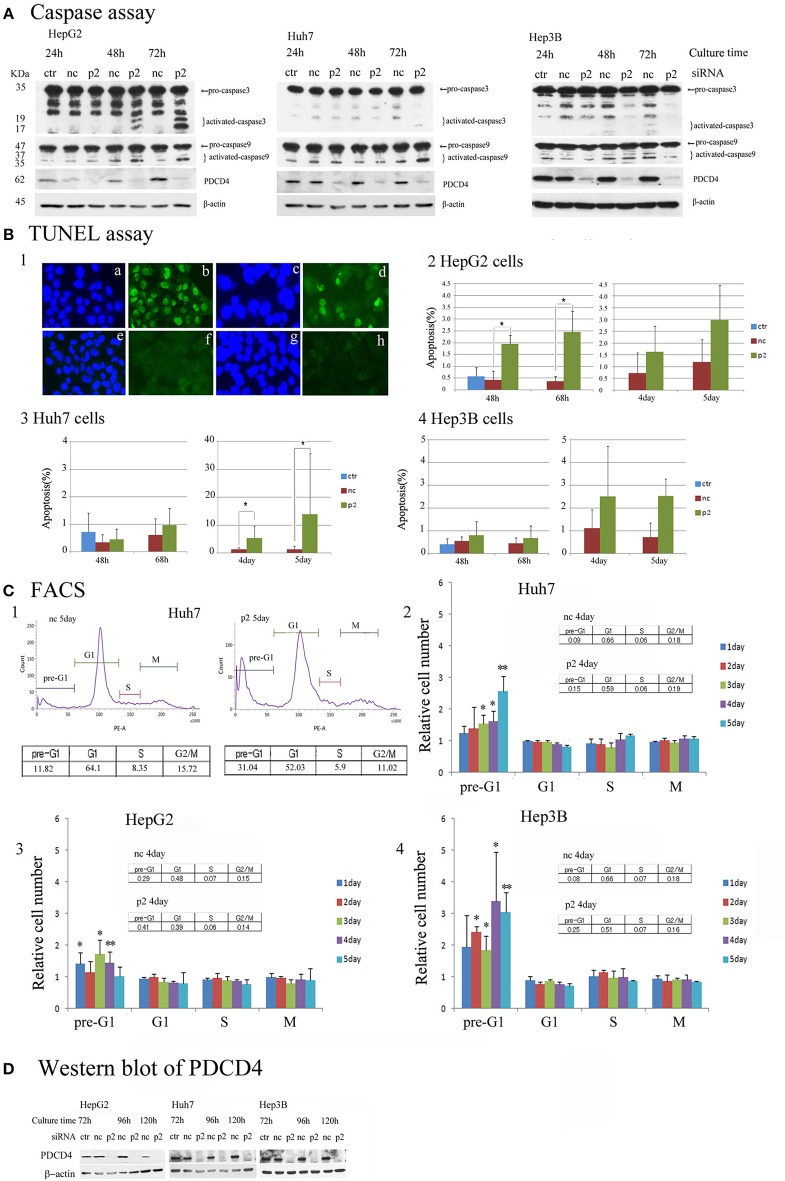
Figure 6.
Apoptosis induced by PDCD4 knockdown in HepG2, Huh7 and Hep3B hepatoma cells. (A) Caspase assays. The experiments were performed as in Figure 2. An immunoblot analysis was performed with antibodies recognizing caspase 3 and caspase 9 for cell extracts of the untreated cells (ctr), negative control siRNA-treated cells (nc) and PDCD4 specific p2 siRNA-treated cells (p2) in HepG2, Huh7, and Hep3B cells. These experiments were repeated two times, and similar results were obtained in both cases. (B) The TUNEL assay. HepG2, Huh7, and Hep3B cells were treated with negative control siRNA (nc) and PDCD4-specific p2 siRNA (p2) and subjected to a TUNEL assay at the culture times indicated in the figures after siRNA transfection. TUNEL-positive cell nuclei were stained with FITC-avidin and the nuclei were visualized by Hoechst staining. Panel 1 shows (a,c,e,g) Hoechst staining and (b,d,f,h) FITC-images of (a,b) HepG2 cells that were treated with DNase as a positive control, (c,d) PDCD4 knockdown cells, (e,f) untreated control cells and (g,h) negative control siRNA-treated cells. Panels 2, 3 and 4 show the amount of apoptotic cells (%) in the control cells without siRNA treatment (ctr), negative control siRNA-treated cells (nc), and PDCD4-specific p2 siRNA-treated cells (p2) in the (2) HepG2, (3) Huh7, and (4) Hep3B. Positive cells were counted under a fluorescent microscope, and the data are shown as the mean ± SD obtained from three independent experiments. Thousands of cells were counted in each experiment. t-test: *p < 0.05. (C) The FACS analysis. HepG2, Huh7, and Hep3B cells were transfected with PDCD4-specific p2 siRNA (p2) and negative control siRNA (nc) as described in the methods. After 1, 2, 3, 4, and 5 days of culture, the cells were collected and stained with propidium iodide (PI). DNA content was then analyzed by FACS. For each sample about 5,000 cells were analyzed. (1) FACS of a negative control siRNA-transfected (nc) and PDCD4-specific p2 siRNA-transfected (p2) Huh7 cell sample at 5 days of culture after siRNA transfection. (2, 3, and 4) The culture time-dependent changes in the cell population at the pre-G1, G1, S and G2/M phases of the cell cycle in (2) Huh7, (3) HepG2, and (4) Hep3B cells are represented as the ratio of PDCD4 siRNA-transfected cells to negative control siRNA-transfected cells. The experiments were independently repeated at least three times, and the data represent the mean ± SD obtained from the experiments. t-test between negative control and PDCD4 knockdown cells: *p < 0.05; **p < 0.005. (D) PDCD4 levels analyzed by Western blot in PDCD4 knockdown cells.

