
Figure 3.
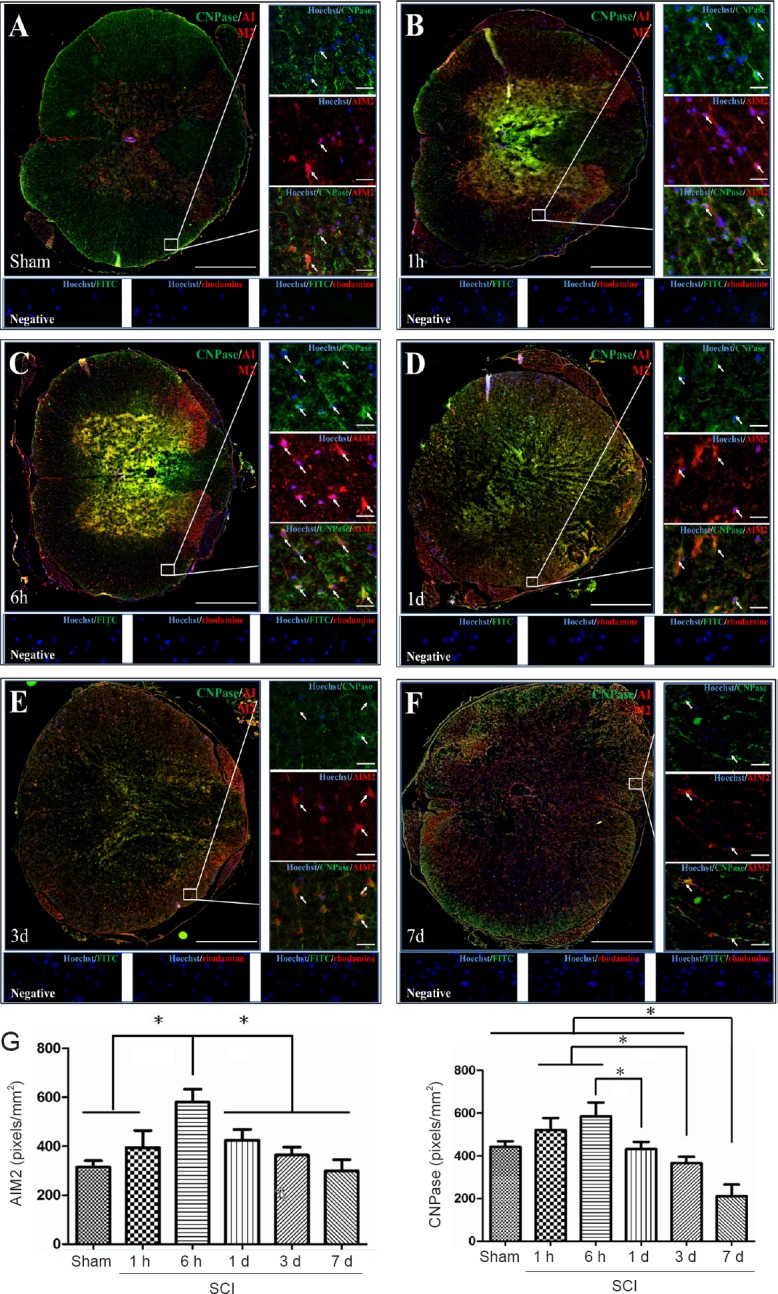
Co-localization of AIM2 with CNPase in the spinal cords of sham-operated and injured rats.
Representative immunofluorescence staining (< 1 mm from the injury epicenter) for CNPase (green) and AIM2 (red) in the sham-operated spinal cord (A) and in the injured spinal cord in the 1-h (B), 6-h (C), 1-d (D), 3-d (E) and 7-d (F) post-injury groups. Hoechst 33342 (blue) was used to counterstain the nuclei. Labeling was observed under a ZEISS Axio Observer microscope. Scale bars: 20 μm in insets (400×); 500 μm at the original magnification (100×). Arrows show double-positive cells. The graph (G) shows the expression levels of AIM2 and CNPase at each time point after SCI. Data are expressed as the mean ± SD (n = 6; one-way analysis of variance, followed by Bonferroni post hoc test). *P < 0.05. AIM2: Absent in melanoma 2; CNPase: 2′,3′-cyclic nucleotide 3′ phosphodiesterase; SCI: spinal cord injury; h: hour(s); d: day(s).