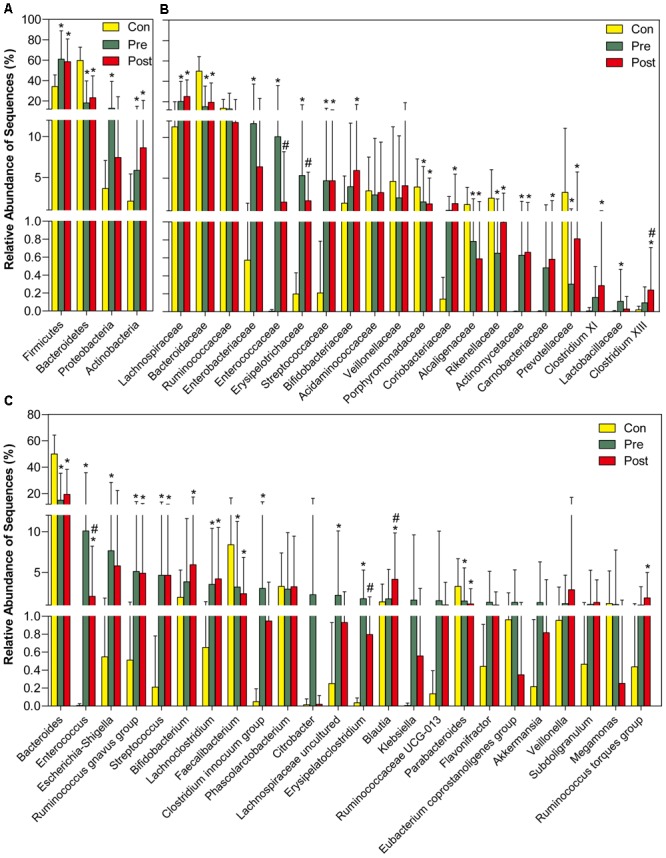
FIGURE 3.

Different bacterial taxa among control and pre- and post-treatment groups. Comparisons of the relative abundance of abundant bacterial taxa at the level of bacterial phylum (A), family (B), and genus (C). The data are presented as the mean ± standard deviation. Mann–Whitney U-tests were used to analyze variation among the three stomach microhabitats. ∗p < 0.05 compared with control group; #p < 0.05 compared with pre-treatment group.
