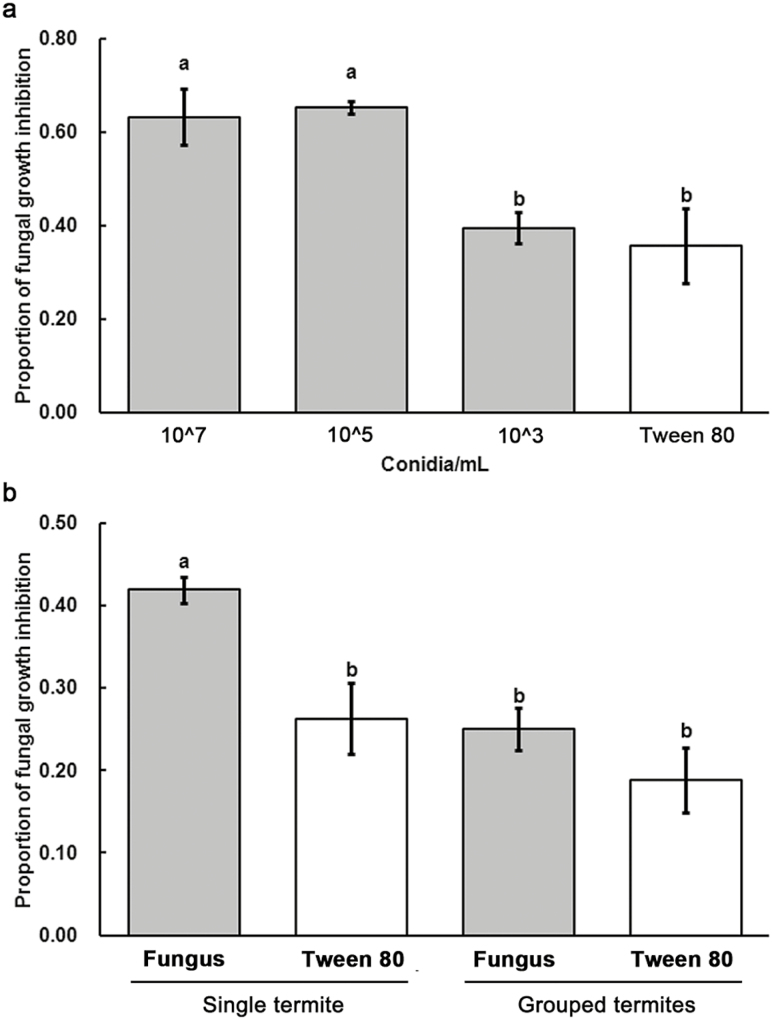
Fig. 4.
Antifungal activity of the termites among different treatments. (a) The antifungal activity of single termites exposed to 5 × 10⁷, 5 × 10⁵, 5 × 10³ conidia/ml, and 0.1% Tween 80, respectively; (b) The antifungal activity of single and grouped termites exposed to 5 × 10⁵ conidia/ml, and single and grouped termites treated by 0.1% Tween 80. Error bars represent mean ± SEM. Different letters over the bars denote significant differences (P < 0.05, Tukey’s HSD).

