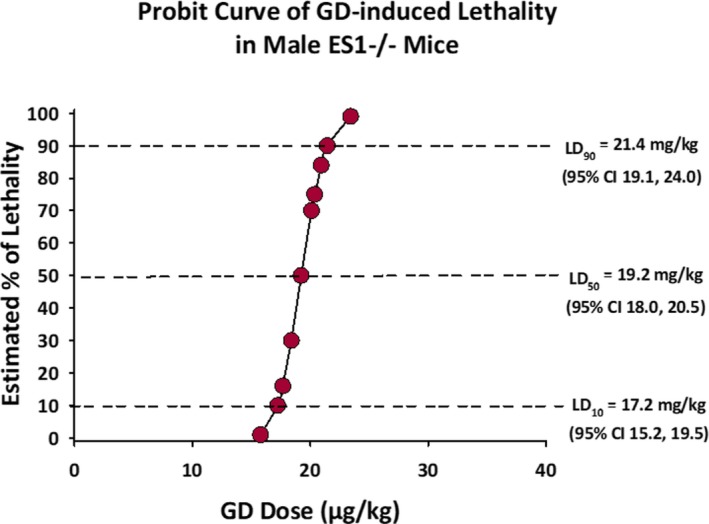
Figure 1.

Dose‐response curve for GD‐induced lethality in adult male ES1−/− mice. Each point in the graph represents the average estimated percent of lethality for adult male ES1−/− mice exposed to a particular dose of GD. At 19.2 μg/kg (95% CI 18.0‐20.5) the LD 50 of GD of male ES1−/− mice was 4 times lower than that of C57BL/6 mice reported in the literature. The LD 10 and LD 90 are also shown in the graph. CI, confidence interval; LD, lethal dose
